Nothing
README.md
In animaltracker: Animal Tracker
Animal Tracker
Overview
This is a repository for an R package with data management and visualization tools for GPS and accelerometer data for tracking animals (e.g., cows). Includes two Shiny Apps to visualize and analyze the associated spatial-temporal data.
Please refer to the PDF manual for detailed information on function usage.
Core Features
Dynamic User Interface and Data
The Animal Tracker app ships with demo data included. Or, conveniently upload your own .csv or .txt animal data files in a zip folder. There is an option for the app to filter bad data points after files are uploaded.

By default, the elevation lookup is bounded by the maximum/minimum latitude and longitude determined from parsing the uploaded data, but the bounds can be modified manually. Similarly, the zoom level defaults to the current map zoom, but can also be changed manually to values from 1-14. Click on the checkboxes to include slope and aspect with elevation.

Use the dropdown selections to filter by site, animal, or date range. The app features will dynamically update based on your selections, and the filtered data is also available as a download.

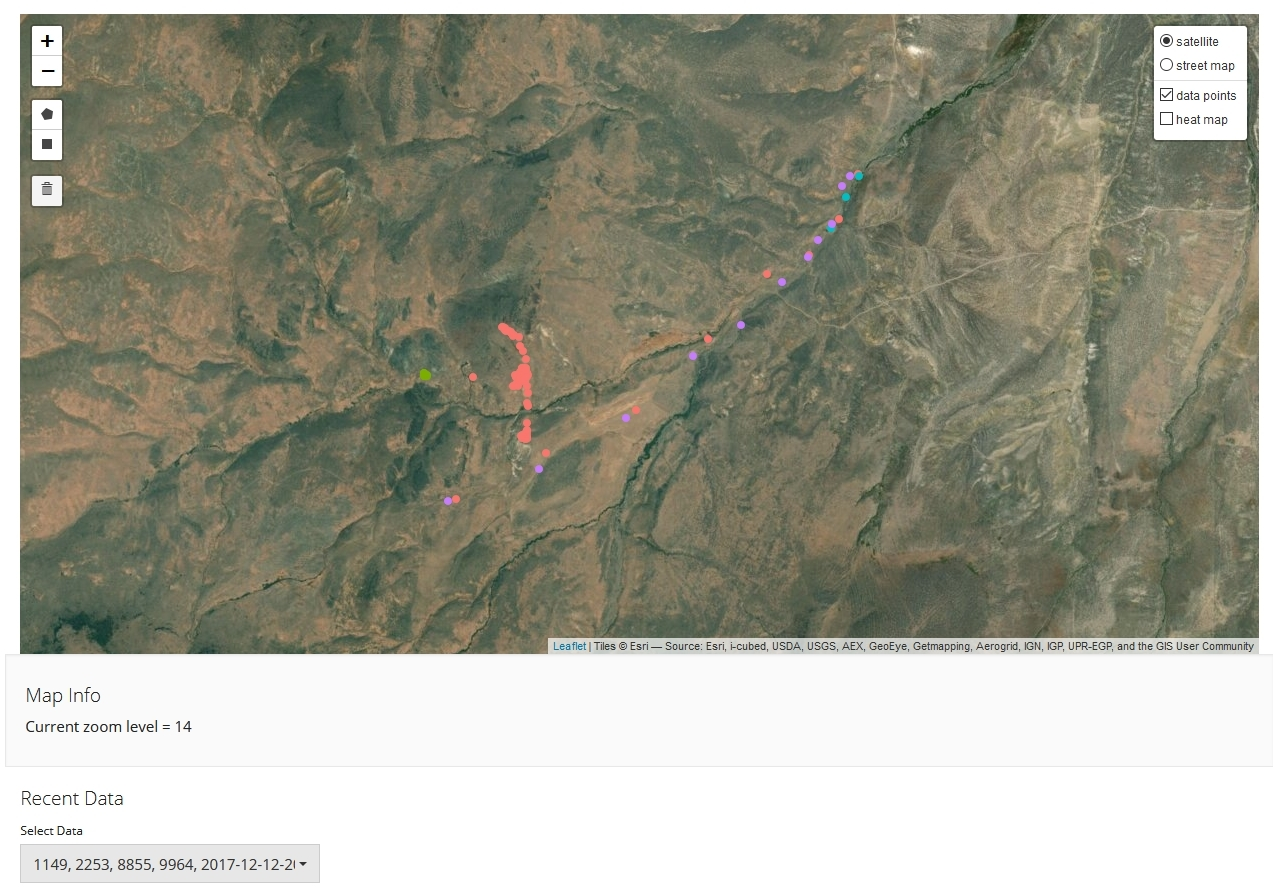
Dynamic Map
In addition, Animal Tracker can visualize the terrain from your animal data. Toggle between point and heatmap views, or overlay both. Draw a rectangle to select a particular region.

Dynamic Plots
Animal Tracker also visualizes and compares your animals' behaviors. Plots include elevation over time by animal and number of points in the sample by animal as well as rate of travel by animal and total time spent by location (not shown).

Dynamic Statistics
The app comes with a statistical summary utility to complement the visualizations. Choose between elevation, time difference between GPS measurements, course, course difference between GPS measurements, distance, and rate to summarize. Then, select from sample size, mean, median, standard deviation, variance, minimum value, maximum value, range, interquartile range, first quartile, and third quartile statistics.

Additional Features
Validation App
Compare and visualize two datasets side-by-side with the validation app. Try the app with the included demo datasets, or upload your own .csv files (.txt is not yet supported).

Outlier detection can also be applied. We currently support modified z-score classification according to Iglewicz and Hoaglin (1993).

Furthermore, summary statistics are provided for flagged data from the app's outlier detection or a method already applied to the data before upload.

Usage
Installation in R
This app can be installed and run through RStudio (or the basic R console).
devtools
Before installing Animal Tracker, ensure that you have the devtools package installed and loaded:
install.packages("devtools")
library(devtools)
animaltracker
Install and load animaltracker by running the following:
install_github(“mathedjoe/animaltracker”)
library(animaltracker)
Core Shiny App
Launch the core shiny app by running the following :
run_shiny_animaltracker()
Validation Shiny App
Launch the validation shiny app by running the following:
run_validation_app()
Questions
Email joechampion@boisestate.edu.
Contributors
- Sergio Arispe (lead researcher), Oregon State University, sergio.arispe@oregonstate.edu
- Joe Champion (lead developer), Boise State University, joechampion@boisestate.edu
- Thea Sukianto (student assistant), Boise State University, TheophiliaSukian@u.boisestate.edu
- Chithkala Dhulipati (student assistant), Boise State University, chithkaladhulipa@u.boisestate.edu
- Dylan Mikesell (researcher), Boise State University, dylanmikesell@boisestate.edu
Try the animaltracker package in your browser
Any scripts or data that you put into this service are public.
animaltracker documentation built on Nov. 18, 2020, 1:08 a.m.
R Package Documentation
Browse R Packages
We want your feedback!
Note that we can't provide technical support on individual packages. You should contact the package authors for that.
Animal Tracker
Overview
This is a repository for an R package with data management and visualization tools for GPS and accelerometer data for tracking animals (e.g., cows). Includes two Shiny Apps to visualize and analyze the associated spatial-temporal data.
Please refer to the PDF manual for detailed information on function usage.
Core Features
Dynamic User Interface and Data
The Animal Tracker app ships with demo data included. Or, conveniently upload your own .csv or .txt animal data files in a zip folder. There is an option for the app to filter bad data points after files are uploaded.
By default, the elevation lookup is bounded by the maximum/minimum latitude and longitude determined from parsing the uploaded data, but the bounds can be modified manually. Similarly, the zoom level defaults to the current map zoom, but can also be changed manually to values from 1-14. Click on the checkboxes to include slope and aspect with elevation.
Use the dropdown selections to filter by site, animal, or date range. The app features will dynamically update based on your selections, and the filtered data is also available as a download.
Dynamic Map
In addition, Animal Tracker can visualize the terrain from your animal data. Toggle between point and heatmap views, or overlay both. Draw a rectangle to select a particular region.
Dynamic Plots
Animal Tracker also visualizes and compares your animals' behaviors. Plots include elevation over time by animal and number of points in the sample by animal as well as rate of travel by animal and total time spent by location (not shown).
Dynamic Statistics
The app comes with a statistical summary utility to complement the visualizations. Choose between elevation, time difference between GPS measurements, course, course difference between GPS measurements, distance, and rate to summarize. Then, select from sample size, mean, median, standard deviation, variance, minimum value, maximum value, range, interquartile range, first quartile, and third quartile statistics.
Additional Features
Validation App
Compare and visualize two datasets side-by-side with the validation app. Try the app with the included demo datasets, or upload your own .csv files (.txt is not yet supported).
Outlier detection can also be applied. We currently support modified z-score classification according to Iglewicz and Hoaglin (1993).
Furthermore, summary statistics are provided for flagged data from the app's outlier detection or a method already applied to the data before upload.
Usage
Installation in R
This app can be installed and run through RStudio (or the basic R console).
devtools
Before installing Animal Tracker, ensure that you have the devtools package installed and loaded:
install.packages("devtools")
library(devtools)
animaltracker
Install and load animaltracker by running the following:
install_github(“mathedjoe/animaltracker”)
library(animaltracker)
Core Shiny App
Launch the core shiny app by running the following :
run_shiny_animaltracker()
Validation Shiny App
Launch the validation shiny app by running the following:
run_validation_app()
Questions
Email joechampion@boisestate.edu.
Contributors
- Sergio Arispe (lead researcher), Oregon State University, sergio.arispe@oregonstate.edu
- Joe Champion (lead developer), Boise State University, joechampion@boisestate.edu
- Thea Sukianto (student assistant), Boise State University, TheophiliaSukian@u.boisestate.edu
- Chithkala Dhulipati (student assistant), Boise State University, chithkaladhulipa@u.boisestate.edu
- Dylan Mikesell (researcher), Boise State University, dylanmikesell@boisestate.edu
Try the animaltracker package in your browser
Any scripts or data that you put into this service are public.
R Package Documentation
Browse R Packages
We want your feedback!
Note that we can't provide technical support on individual packages. You should contact the package authors for that.
Embedding an R snippet on your website
Add the following code to your website.
For more information on customizing the embed code, read Embedding Snippets.