README.md
In PeeperLab/Rtoolbox: Toolbox with R scripts
Rtoolbox
Toolbox with R scripts (mostly bioinformatic; see below).
Installation R-package:
After installing the required tools as described above you can download the pre-compiled Rtoolbox R-package.
The package can be installed from the command line using the following command:
$ R CMD INSTALL Rtoolbox_*.tar.gz
Rtoolbox usage:
Load the Rtoolbox package in R using:
> library("Rtoolbox")
Rtoolbox contains the following functions:
replotGSEA
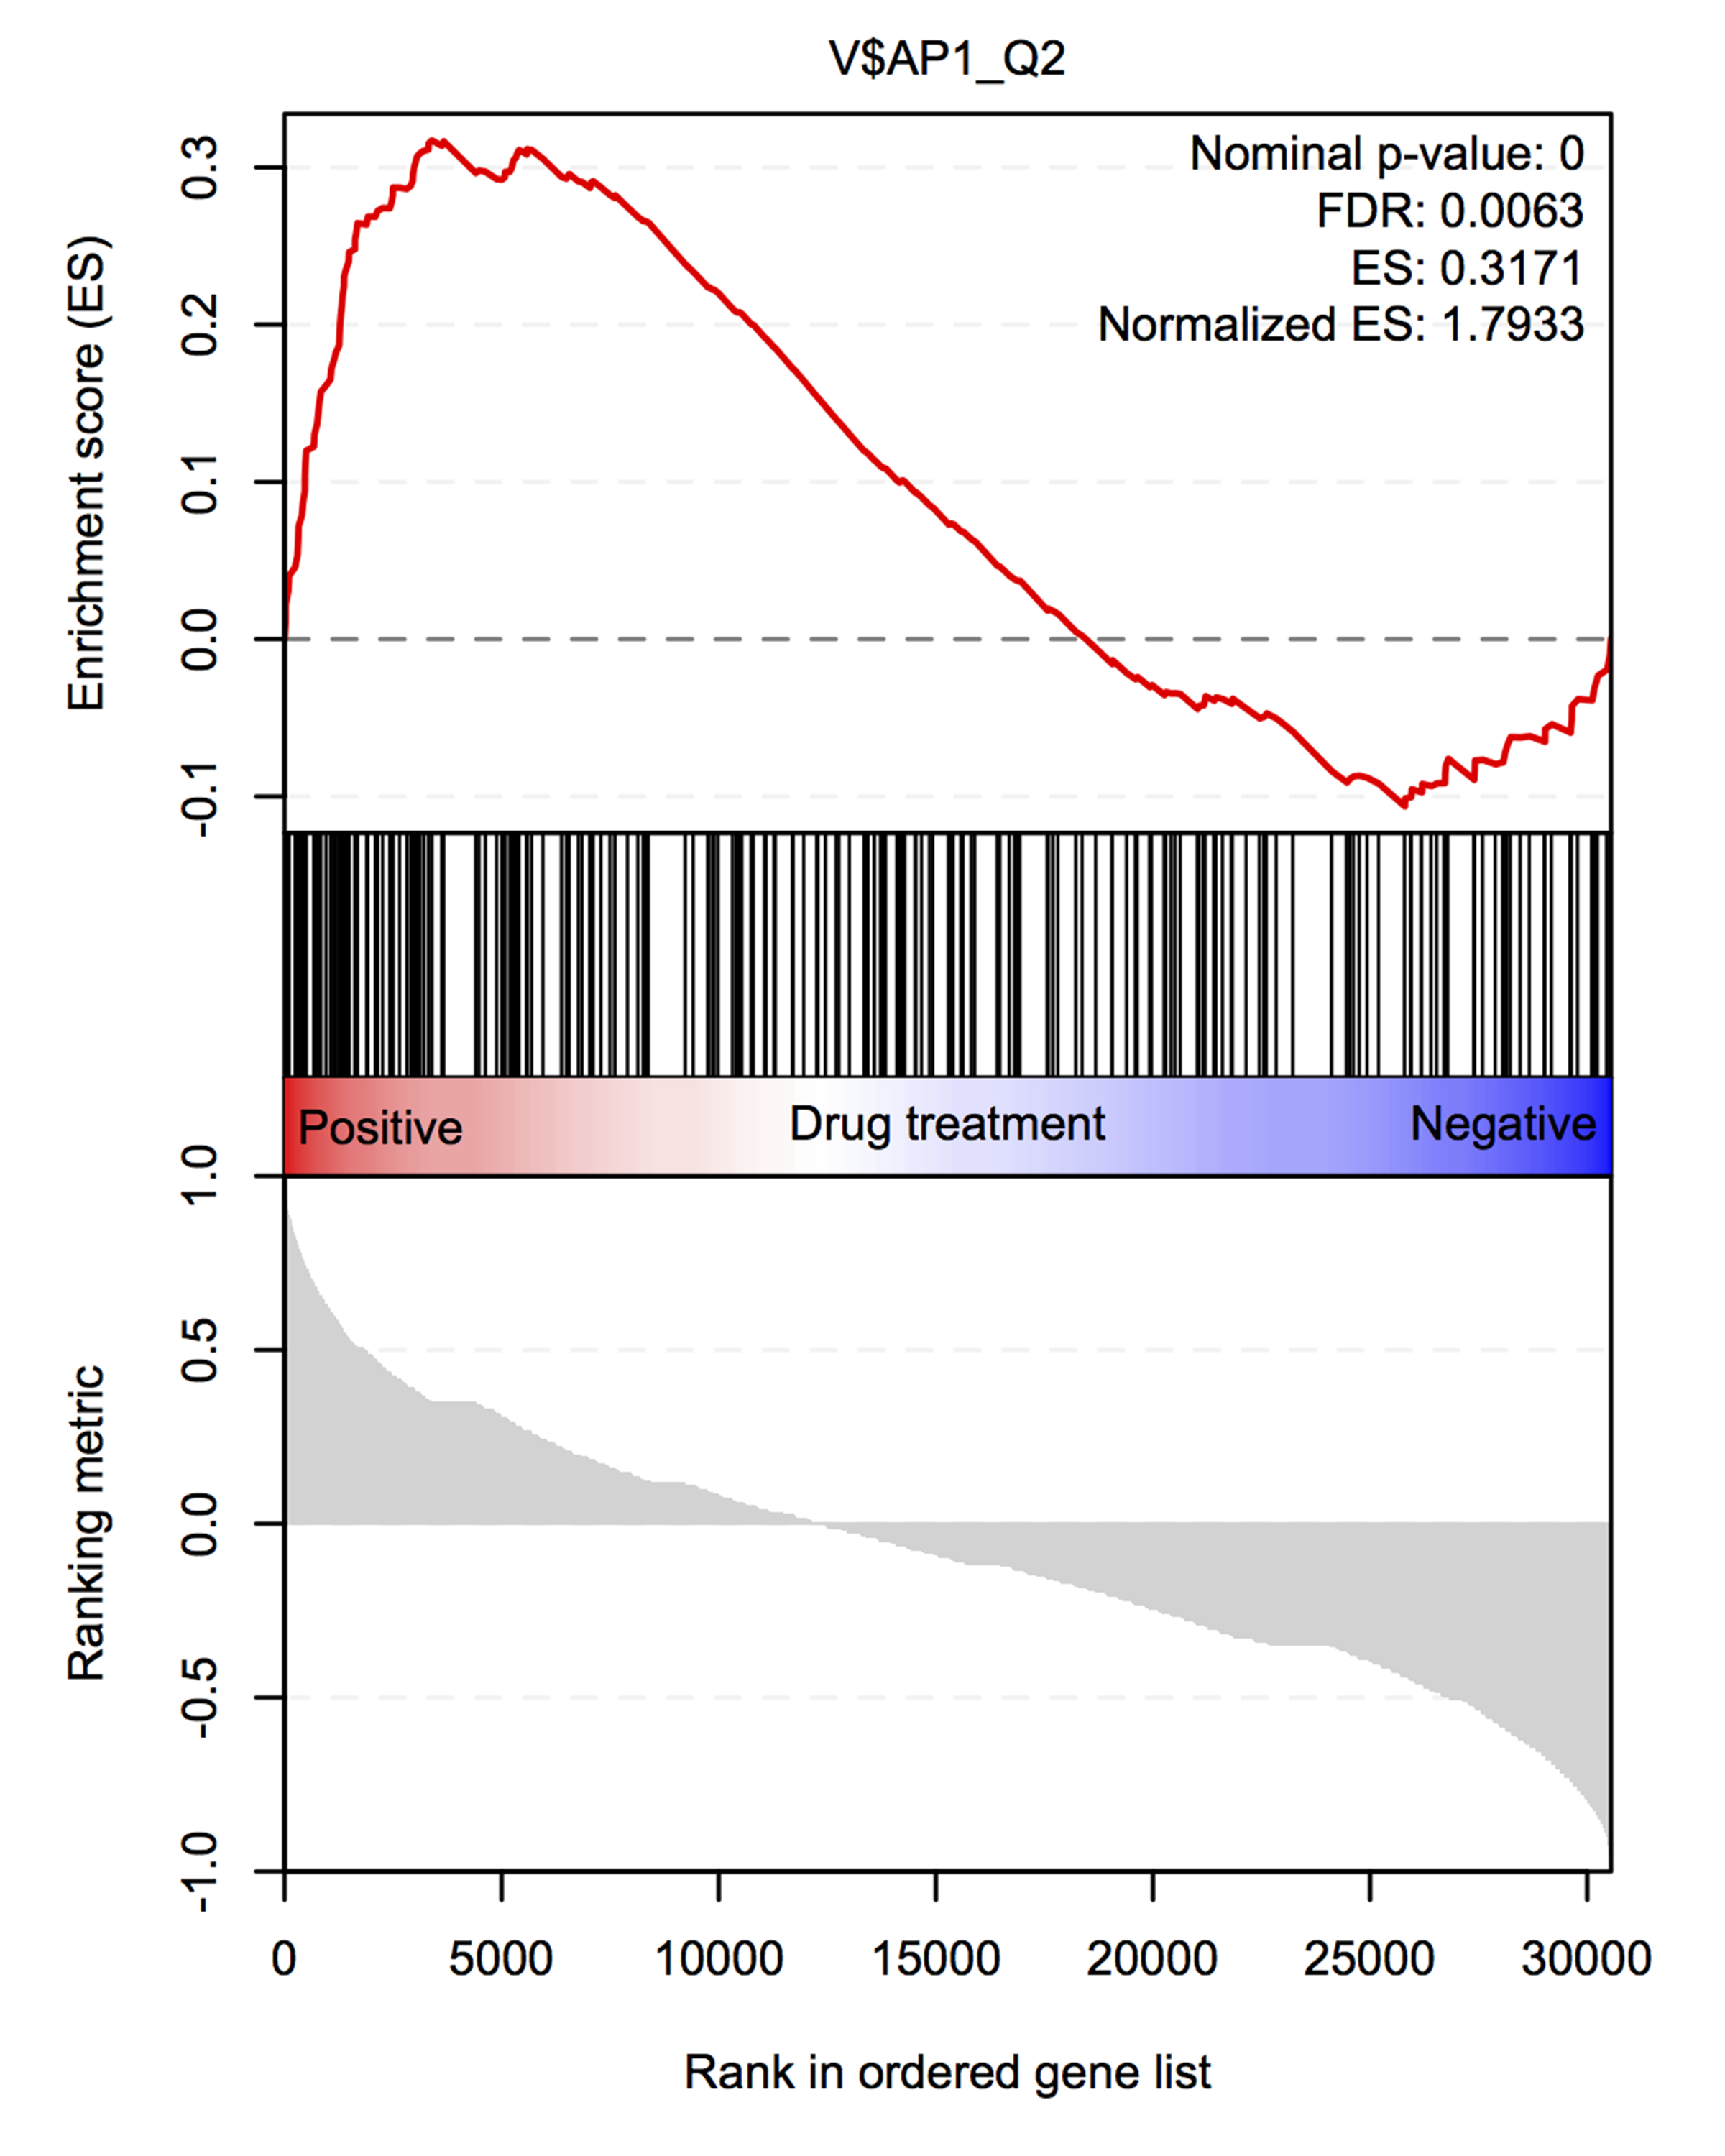
replotGSEA re-plots data from the javaGSEA desktop version in R. The function
takes three arguments: path, the path to the javaGSEA output folder;
gene.set, which is the name of the gene set you want to plot (note:
approximate matching is used in a grep-function to determine the appropriate
gene set); and class.name, which is the name of the variable to which gene
expression has been matched (i.e., the description of the variable that is
specified in the .cls file or that is used to pre-rank the data; example:
"drug treatment").
Example replotGSEA
For the example of the output of replotGSEA, the following command was used:
replotGSEA(path = path, gene.set = gene.set, class.name = class.name)

OverviewPlot
OverviewPlot will create color-based plots of segmentation values as found in the provided DNAcopy object.
The heatmap plotting function has three optional arguments: samples, range.CNA, and color.palette.
The samples argument can be used to specify which samples need to be included in the plotting.
The range.CNA range specifies the range of values that will be plotted; segmentation values outside of this range are capped to either the minimum or the maximum of range.CNA.
The color.palette argument can be used to customize the colors used for plotting.
Example OverviewPlot
For the example of the output of OverviewPlot, the following command was used:
OverviewPlot(DNAcopy.object, unique(DNAcopy.object$output$ID)[1:2], range.CNA = c(-1,1))

PeeperLab/Rtoolbox documentation built on May 8, 2019, 1:28 a.m.
Rtoolbox
Toolbox with R scripts (mostly bioinformatic; see below).
Installation R-package:
After installing the required tools as described above you can download the pre-compiled Rtoolbox R-package. The package can be installed from the command line using the following command:
$ R CMD INSTALL Rtoolbox_*.tar.gz
Rtoolbox usage:
Load the Rtoolbox package in R using:
> library("Rtoolbox")
Rtoolbox contains the following functions:
replotGSEA
replotGSEA re-plots data from the javaGSEA desktop version in R. The function
takes three arguments: path, the path to the javaGSEA output folder;
gene.set, which is the name of the gene set you want to plot (note:
approximate matching is used in a grep-function to determine the appropriate
gene set); and class.name, which is the name of the variable to which gene
expression has been matched (i.e., the description of the variable that is
specified in the .cls file or that is used to pre-rank the data; example:
"drug treatment").
Example replotGSEA
For the example of the output of replotGSEA, the following command was used:
replotGSEA(path = path, gene.set = gene.set, class.name = class.name)

OverviewPlot
OverviewPlot will create color-based plots of segmentation values as found in the provided DNAcopy object. The heatmap plotting function has three optional arguments: samples, range.CNA, and color.palette. The samples argument can be used to specify which samples need to be included in the plotting. The range.CNA range specifies the range of values that will be plotted; segmentation values outside of this range are capped to either the minimum or the maximum of range.CNA. The color.palette argument can be used to customize the colors used for plotting.
Example OverviewPlot
For the example of the output of OverviewPlot, the following command was used:
OverviewPlot(DNAcopy.object, unique(DNAcopy.object$output$ID)[1:2], range.CNA = c(-1,1))

Add the following code to your website.
For more information on customizing the embed code, read Embedding Snippets.
