README.md
In almartin82/NYSEDtools: Data Management, Analysis, Visualization and Reporting Tools for NYSED L2RPT Data
NYSEDtools
Development note: Development on NYSEDtools is currently paused, as I'm not interacting with reports and data from New York in my day job. It is likely that data formats have drifted since these tools were actively developed in 2017. If anyone is interested in working with L2RPT data, please feel free to file an issue in the repo and ping me at almartin at gmail dot com.
Tools for working with educational data from New York State's Level 2 Reporting System (L2RPT)

Why NYSEDtools?
All New York State school districts receive data from the state in a common data format. NYSEDtools attempts to make a data analyst's life easier by providing an expressive vocabulary of data cleaning functions, analysis, calculations, and visualizations that show the progress of schools, grade levels, and students.
Quickstart!
Getting the data from L2RPT
NYS test data is released through the 'State Level 2 Reports' (L2RPT) system, which is an IBM Cognos platform. You can read more about L2RPT on the NYSED website.
NYSEDtools uses the 'SIRS-301 Tested/Not Tested Confirmation Report', which can be found at L2RPT - SEDDAS > Tested / Not Tested, > SIRS-301 Tested/Not Tested Confirmation Report.
Choose the most general options possible (you will need to run ELA, Math and Science exports separately).
Click on the All Students row and Tested column to get a table of individual student records, then View in Excel Options > View in Excel 2007 Format. This package consumes those export files - save them to your computer. You will likely need to generate several export files to cover all the years of data housed in L2RPT.
Loading data exports from L2RPT
This quickstart uses dummy data so that you can get a feel for what the package does. (Dummy data can be found in inst/raw-data if you want to see how it is organized). All data in those files is procedurally generated, not merely anonymized, meaning that while it simulates the look and feel of a L2RPT file, it is not derived from personally identifiable student data in any way.
raw_301 <- NYSEDtools::sirs301_import_csvs(path = file.path('inst', 'raw-data'))

head(raw_301)
# A tibble: 6 x 26
  DISTRICT_NAME DISTRICT_KEY LOCATION_NAME LOCATION_KEY_RSP_SCH     STUDENT_NAME
          <chr>        <chr>         <chr>                <chr>            <chr>
1 DEMO DISTRICT     80099999   DEMO SCHOOL                 9999 Sample Student 1
2 DEMO DISTRICT     80099999   DEMO SCHOOL                 9999 Sample Student 2
3 DEMO DISTRICT     80099999   DEMO SCHOOL                 9999 Sample Student 3
4 DEMO DISTRICT     80099999   DEMO SCHOOL                 9999 Sample Student 4
5 DEMO DISTRICT     80099999   DEMO SCHOOL                 9999 Sample Student 5
6 DEMO DISTRICT     80099999   DEMO SCHOOL                 9999 Sample Student 6
# ... with 21 more variables: STUDENT_ID <chr>, STUDENT_ID_ALT <chr>,
#   STUDENT_GENDER <chr>, CURR_GRADE_LVL <chr>, ITEM_KEY <chr>, `Assessment
#   Description` <chr>, CHALLENGE_TYPE <chr>, ETHNIC_DESC <chr>, LEP_DURATION <chr>,
#   LEP_ELIGIBILITY <chr>, POVERTY <chr>, NUMERIC_SCORE <chr>, STANDARD_ACHIEVED <chr>,
#   STD_ACHIEVED_CODE <chr>, TEST_STATUS <chr>, NYSESLAT_ELIGIBLE <chr>,
#   NYSAA_ELIGIBLE <chr>, FORMER_LEP <chr>, FORMER_SWD <chr>, REPORT_SCHOOL_YEAR <chr>,
#   MODIFIED_DATE <chr>
sirs301_import_csvs will look recursively through any sub-directory that you give it, so it's fine to organize the raw data exports by year, school, subject - whatever.
Creating the sirs301 object
This package processes the raw sirs 301 data and creates a custom data object, class sirs301. That custom object has cleaned up data frames (ie, numeric performance levels) and calculated fields, like growth. Having this cleaned-up object powers the analysis and visualization functions included in the package.
demo_301 <- NYSEDtools::sirs301(csvs = raw_301)
demo_301
> demo_301
A sirs301 object repesenting:
- 2 school years
- 468 students from 1 schools

The sirs301 object has 4 dataframes, named:
ela_math, sci, nyseslat, growth
The payoff - easy visualizations, analysis, and insight!
Now that you have a sirs301 object you can hand it off to the visualization and analysis functions in this package.
The general recipe for a visualization or analysis function is:
- a
sirs301 object
- a vector of studentids
Most of the time school data analysts are interested in grade levels of students. That's easy to do in this framework - simply create a vector of studentids that, for instance, corresponds to '6th grade students at Demo School' and pass that to the visualization or analysis function.
First let's save the studentids of the current 6th graders to a vector:
gr6 <- demo_301$ela_math %>%
  dplyr::filter(location_name == 'DEMO SCHOOL' & test_grade == 6 & test_year == 2017) %>%
  dplyr::select(student_id) %>%
  unlist() %>% unname() %>% unique()

gr6
> gr6
 [1] "215999101" "215999102" "215999103" "215999104" "215999105" "215999106" "215999107" "215999108"
 [9] "215999109" "215999110" "215999111" "215999112" "215999113" "215999114" "215999115" "215999116"
[17] "215999117" "215999118" "215999119" "215999120" "215999121" "215999122" "215999123" "215999124"
[25] "215999125" "215999126" "215999127" "215999128" "215999129" "215999130" "215999131" "215999132"
[33] "215999133" "215999134" "215999135" "215999136" "215999137" "215999138" "215999139" "215999140"
[41] "215999141" "215999142" "215999143" "215999144" "215999145" "215999146" "215999147" "215999148"
[49] "215999149" "215999150" "215999151" "215999152" "215999153" "215999154" "215999155" "215999156"
[57] "215999157" "215999158" "215999159" "215999160" "215999161" "215999162" "215999163" "215999164"
[65] "215999165" "215999166" "215999167" "215999168" "215999169" "215999170" "215999171" "215999172"
[73] "215999173" "215999174" "215999175" "215999176" "215999177" "215999178" "215999179" "215999180"
[81] "215999181" "215999182" "215999183" "215999184" "215999185" "215999186" "215999187" "215999188"
[89] "215999189" "215999190" "215999191"
Now we'll generate cohort_performance_bins for these students by passing that vector to studentids:
gr6_math_bins <- cohort_performance_bins(
  sirs301_obj = demo_301,
  studentids = gr6,
  subject = 'Math'
)

gr6_math_bins
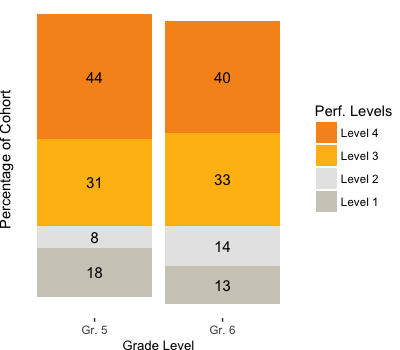
Cohort performance bins shows what percentage of students in the cohort were at a given performance level over time. It's an easy way to track the progress of a cohort.
You try it!
My hope is that other data analysts who work with NYS data could collaborate - or even just benefit from! - this work by using it to aid in the analysis of their state test data.
You could use NYSEDtools
- purely as a workflow tool to help clean your L2RPT data
- as a workflow tool to calculate change over time
- as a reporting/analysis tool, making use of some of the visualization and analytic functions
Things to know
- Your district may have internal structure (ie two 'schools' that operate under one K-8 charter). If that's the case, you'll need to update
location_name based on your grade structure.
Contributing
Contributions are welcome!
You can:
- submit suggestions and bug-reports at: https://github.com/almartin82/NYSEDtools/issues
- send a pull request on: https://github.com/almartin82/NYSEDtools
- compose a friendly e-mail to almartin@gmail.com
Please note that this project is released with a Contributor Code of Conduct. By participating in this project you agree to abide by its terms.
almartin82/NYSEDtools documentation built on June 3, 2023, 10:52 a.m.
R Package Documentation
Browse R Packages
We want your feedback!
Note that we can't provide technical support on individual packages. You should contact the package authors for that.
NYSEDtools
Development note: Development on NYSEDtools is currently paused, as I'm not interacting with reports and data from New York in my day job. It is likely that data formats have drifted since these tools were actively developed in 2017. If anyone is interested in working with L2RPT data, please feel free to file an issue in the repo and ping me at almartin at gmail dot com.
Tools for working with educational data from New York State's Level 2 Reporting System (L2RPT)
Why NYSEDtools?
All New York State school districts receive data from the state in a common data format. NYSEDtools attempts to make a data analyst's life easier by providing an expressive vocabulary of data cleaning functions, analysis, calculations, and visualizations that show the progress of schools, grade levels, and students.
Quickstart!
Getting the data from L2RPT
NYS test data is released through the 'State Level 2 Reports' (L2RPT) system, which is an IBM Cognos platform. You can read more about L2RPT on the NYSED website.
NYSEDtools uses the 'SIRS-301 Tested/Not Tested Confirmation Report', which can be found at L2RPT - SEDDAS > Tested / Not Tested, > SIRS-301 Tested/Not Tested Confirmation Report.
Choose the most general options possible (you will need to run ELA, Math and Science exports separately).
Click on the All Students row and Tested column to get a table of individual student records, then View in Excel Options > View in Excel 2007 Format. This package consumes those export files - save them to your computer. You will likely need to generate several export files to cover all the years of data housed in L2RPT.
Loading data exports from L2RPT
This quickstart uses dummy data so that you can get a feel for what the package does. (Dummy data can be found in inst/raw-data if you want to see how it is organized). All data in those files is procedurally generated, not merely anonymized, meaning that while it simulates the look and feel of a L2RPT file, it is not derived from personally identifiable student data in any way.
raw_301 <- NYSEDtools::sirs301_import_csvs(path = file.path('inst', 'raw-data'))
head(raw_301)
# A tibble: 6 x 26
DISTRICT_NAME DISTRICT_KEY LOCATION_NAME LOCATION_KEY_RSP_SCH STUDENT_NAME
<chr> <chr> <chr> <chr> <chr>
1 DEMO DISTRICT 80099999 DEMO SCHOOL 9999 Sample Student 1
2 DEMO DISTRICT 80099999 DEMO SCHOOL 9999 Sample Student 2
3 DEMO DISTRICT 80099999 DEMO SCHOOL 9999 Sample Student 3
4 DEMO DISTRICT 80099999 DEMO SCHOOL 9999 Sample Student 4
5 DEMO DISTRICT 80099999 DEMO SCHOOL 9999 Sample Student 5
6 DEMO DISTRICT 80099999 DEMO SCHOOL 9999 Sample Student 6
# ... with 21 more variables: STUDENT_ID <chr>, STUDENT_ID_ALT <chr>,
# STUDENT_GENDER <chr>, CURR_GRADE_LVL <chr>, ITEM_KEY <chr>, `Assessment
# Description` <chr>, CHALLENGE_TYPE <chr>, ETHNIC_DESC <chr>, LEP_DURATION <chr>,
# LEP_ELIGIBILITY <chr>, POVERTY <chr>, NUMERIC_SCORE <chr>, STANDARD_ACHIEVED <chr>,
# STD_ACHIEVED_CODE <chr>, TEST_STATUS <chr>, NYSESLAT_ELIGIBLE <chr>,
# NYSAA_ELIGIBLE <chr>, FORMER_LEP <chr>, FORMER_SWD <chr>, REPORT_SCHOOL_YEAR <chr>,
# MODIFIED_DATE <chr>
sirs301_import_csvs will look recursively through any sub-directory that you give it, so it's fine to organize the raw data exports by year, school, subject - whatever.
Creating the sirs301 object
This package processes the raw sirs 301 data and creates a custom data object, class sirs301. That custom object has cleaned up data frames (ie, numeric performance levels) and calculated fields, like growth. Having this cleaned-up object powers the analysis and visualization functions included in the package.
demo_301 <- NYSEDtools::sirs301(csvs = raw_301)
demo_301
> demo_301
A sirs301 object repesenting:
- 2 school years
- 468 students from 1 schools
The sirs301 object has 4 dataframes, named:
ela_math, sci, nyseslat, growth
The payoff - easy visualizations, analysis, and insight!
Now that you have a sirs301 object you can hand it off to the visualization and analysis functions in this package.
The general recipe for a visualization or analysis function is:
- a
sirs301object - a vector of studentids
Most of the time school data analysts are interested in grade levels of students. That's easy to do in this framework - simply create a vector of studentids that, for instance, corresponds to '6th grade students at Demo School' and pass that to the visualization or analysis function.
First let's save the studentids of the current 6th graders to a vector:
gr6 <- demo_301$ela_math %>%
dplyr::filter(location_name == 'DEMO SCHOOL' & test_grade == 6 & test_year == 2017) %>%
dplyr::select(student_id) %>%
unlist() %>% unname() %>% unique()
gr6
> gr6
[1] "215999101" "215999102" "215999103" "215999104" "215999105" "215999106" "215999107" "215999108"
[9] "215999109" "215999110" "215999111" "215999112" "215999113" "215999114" "215999115" "215999116"
[17] "215999117" "215999118" "215999119" "215999120" "215999121" "215999122" "215999123" "215999124"
[25] "215999125" "215999126" "215999127" "215999128" "215999129" "215999130" "215999131" "215999132"
[33] "215999133" "215999134" "215999135" "215999136" "215999137" "215999138" "215999139" "215999140"
[41] "215999141" "215999142" "215999143" "215999144" "215999145" "215999146" "215999147" "215999148"
[49] "215999149" "215999150" "215999151" "215999152" "215999153" "215999154" "215999155" "215999156"
[57] "215999157" "215999158" "215999159" "215999160" "215999161" "215999162" "215999163" "215999164"
[65] "215999165" "215999166" "215999167" "215999168" "215999169" "215999170" "215999171" "215999172"
[73] "215999173" "215999174" "215999175" "215999176" "215999177" "215999178" "215999179" "215999180"
[81] "215999181" "215999182" "215999183" "215999184" "215999185" "215999186" "215999187" "215999188"
[89] "215999189" "215999190" "215999191"
Now we'll generate cohort_performance_bins for these students by passing that vector to studentids:
gr6_math_bins <- cohort_performance_bins(
sirs301_obj = demo_301,
studentids = gr6,
subject = 'Math'
)
gr6_math_bins
Cohort performance bins shows what percentage of students in the cohort were at a given performance level over time. It's an easy way to track the progress of a cohort.
You try it!
My hope is that other data analysts who work with NYS data could collaborate - or even just benefit from! - this work by using it to aid in the analysis of their state test data.
You could use NYSEDtools
- purely as a workflow tool to help clean your L2RPT data
- as a workflow tool to calculate change over time
- as a reporting/analysis tool, making use of some of the visualization and analytic functions
Things to know
- Your district may have internal structure (ie two 'schools' that operate under one K-8 charter). If that's the case, you'll need to update
location_namebased on your grade structure.
Contributing
Contributions are welcome!
You can:
- submit suggestions and bug-reports at: https://github.com/almartin82/NYSEDtools/issues
- send a pull request on: https://github.com/almartin82/NYSEDtools
- compose a friendly e-mail to almartin@gmail.com
Please note that this project is released with a Contributor Code of Conduct. By participating in this project you agree to abide by its terms.
R Package Documentation
Browse R Packages
We want your feedback!
Note that we can't provide technical support on individual packages. You should contact the package authors for that.
Embedding an R snippet on your website
Add the following code to your website.
For more information on customizing the embed code, read Embedding Snippets.