README.md
In cmap/morpheus.R: Interactive heat maps using 'morpheus.js' and 'htmlwidgets'
Morpheus
Morpheus.js-based heat map widget in R.
Install
devtools::install_github('cmap/morpheus.R')
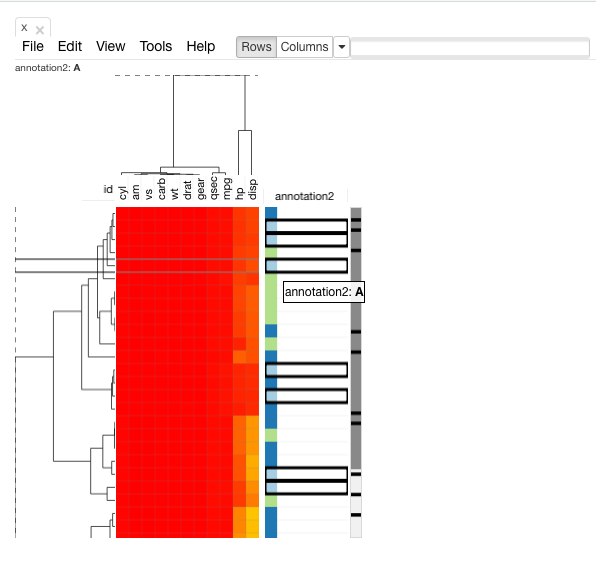
Example 1
library(morpheus)
rowAnnotations <- data.frame(annotation1=1:32, annotation2=sample(LETTERS[1:3], nrow(mtcars), replace = TRUE))
morpheus(mtcars, colorScheme=list(scalingMode="fixed", colors=heat.colors(3)), rowAnnotations=rowAnnotations, overrideRowDefaults=FALSE, rows=list(list(field='annotation2', highlightMatchingValues=TRUE, display=list('color'))))
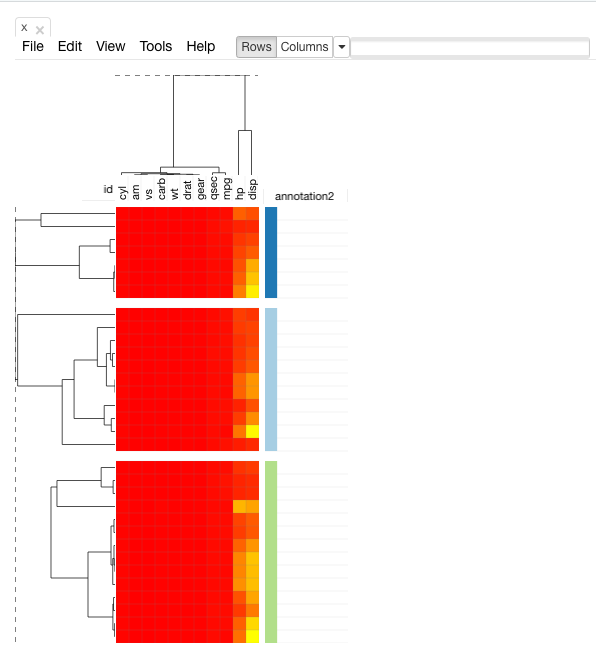
## Example 2
library(morpheus)
rowAnnotations <- data.frame(annotation1=1:32, annotation2=sample(LETTERS[1:3], nrow(mtcars), replace = TRUE))
morpheus(mtcars, dendrogram='column', colorScheme=list(scalingMode="fixed", colors=heat.colors(3)), rowAnnotations=rowAnnotations, tools=list(list(name='Hierarchical Clustering', params=list(group_rows_by=list('annotation2'), cluster='Rows'))), rowGroupBy=list(list(field='annotation2')),
rows=list(list(field='annotation2',display=list('color'))))
Shiny Example
library(morpheus)
library(shiny)
ui <- fluidPage(
  titlePanel(h3("Example")),
  mainPanel(
    morpheusOutput("heatmap")
  )
)

server <- function(input, output) {
  output$heatmap <- renderMorpheus({
    x <- matrix(rnorm(200), 20)
    y <- data.frame(a=letters[1:10], b=rep(c("g","h"),5), stringsAsFactors = F)
    morpheus(x, columnAnnotations = y)
  })
}

shinyApp(ui, server)

cmap/morpheus.R documentation built on Oct. 26, 2020, 3:39 p.m.
R Package Documentation
Browse R Packages
We want your feedback!
Note that we can't provide technical support on individual packages. You should contact the package authors for that.
Morpheus
Morpheus.js-based heat map widget in R.
Install
devtools::install_github('cmap/morpheus.R')
Example 1
library(morpheus)
rowAnnotations <- data.frame(annotation1=1:32, annotation2=sample(LETTERS[1:3], nrow(mtcars), replace = TRUE))
morpheus(mtcars, colorScheme=list(scalingMode="fixed", colors=heat.colors(3)), rowAnnotations=rowAnnotations, overrideRowDefaults=FALSE, rows=list(list(field='annotation2', highlightMatchingValues=TRUE, display=list('color'))))
## Example 2
library(morpheus)
rowAnnotations <- data.frame(annotation1=1:32, annotation2=sample(LETTERS[1:3], nrow(mtcars), replace = TRUE))
morpheus(mtcars, dendrogram='column', colorScheme=list(scalingMode="fixed", colors=heat.colors(3)), rowAnnotations=rowAnnotations, tools=list(list(name='Hierarchical Clustering', params=list(group_rows_by=list('annotation2'), cluster='Rows'))), rowGroupBy=list(list(field='annotation2')),
rows=list(list(field='annotation2',display=list('color'))))
Shiny Example
library(morpheus)
library(shiny)
ui <- fluidPage(
titlePanel(h3("Example")),
mainPanel(
morpheusOutput("heatmap")
)
)
server <- function(input, output) {
output$heatmap <- renderMorpheus({
x <- matrix(rnorm(200), 20)
y <- data.frame(a=letters[1:10], b=rep(c("g","h"),5), stringsAsFactors = F)
morpheus(x, columnAnnotations = y)
})
}
shinyApp(ui, server)
R Package Documentation
Browse R Packages
We want your feedback!
Note that we can't provide technical support on individual packages. You should contact the package authors for that.
Embedding an R snippet on your website
Add the following code to your website.
For more information on customizing the embed code, read Embedding Snippets.