README.md
In juldebar/IRDTunaAtlas: IRD (www.ird.fr) - UMR EME - Tuna atlas
IRD / UMR MARBEC Tuna Atlas: set of generic indicators for Fisheries datasets
Indicators for Fisheries: use case of the Tuna Atlas


See documentation : https://github.com/jsubei/IRDTunaAtlas/wiki
Tuna Atlas interactive maps and charts
This github page contains the code which:
- extracts input data from the Tuna Atlas developed jointly by IRD & FAO,
- transforms input data to generates maps and plots: R functions or scripts,
- packages maps and charts within either dynamic reports, shiny apps, jupyter notebooks...
Input data are obtained from a spatial data infrastructure currently hosted within the Fisheries Atlas VRE of the Blue Cloud H2020 project.
Analysis code
Key elements of the analysis code are a set of indicators originally drafted by Alain Fontenau which were written in R by Norbert Billet and Julien Barde during iMarine FP7 project:
- Indicator I1 : Annual catches by ocean – an R script that extracts and reformats time-series stored within a Potgres/Postgis database. The output files are saved in the outputs/www/html/tmp folder.
- Indicator I2 : Annual catches by gear
- Indicator I3 : Catches by gear and by month
- Indicator I4 : Catches by month and by ocean
- Indicator I6 : Catches by 5x5 degrees
- Indicator I7 : 5x5 degrees relative contribution to catches
- Indicator I8 : Catches relative contribution over other species
- Indicator I9 : Size frequencies by school type
- Indicator I10 : Size frequencies by decade
- Indicator I11 : Catches by country
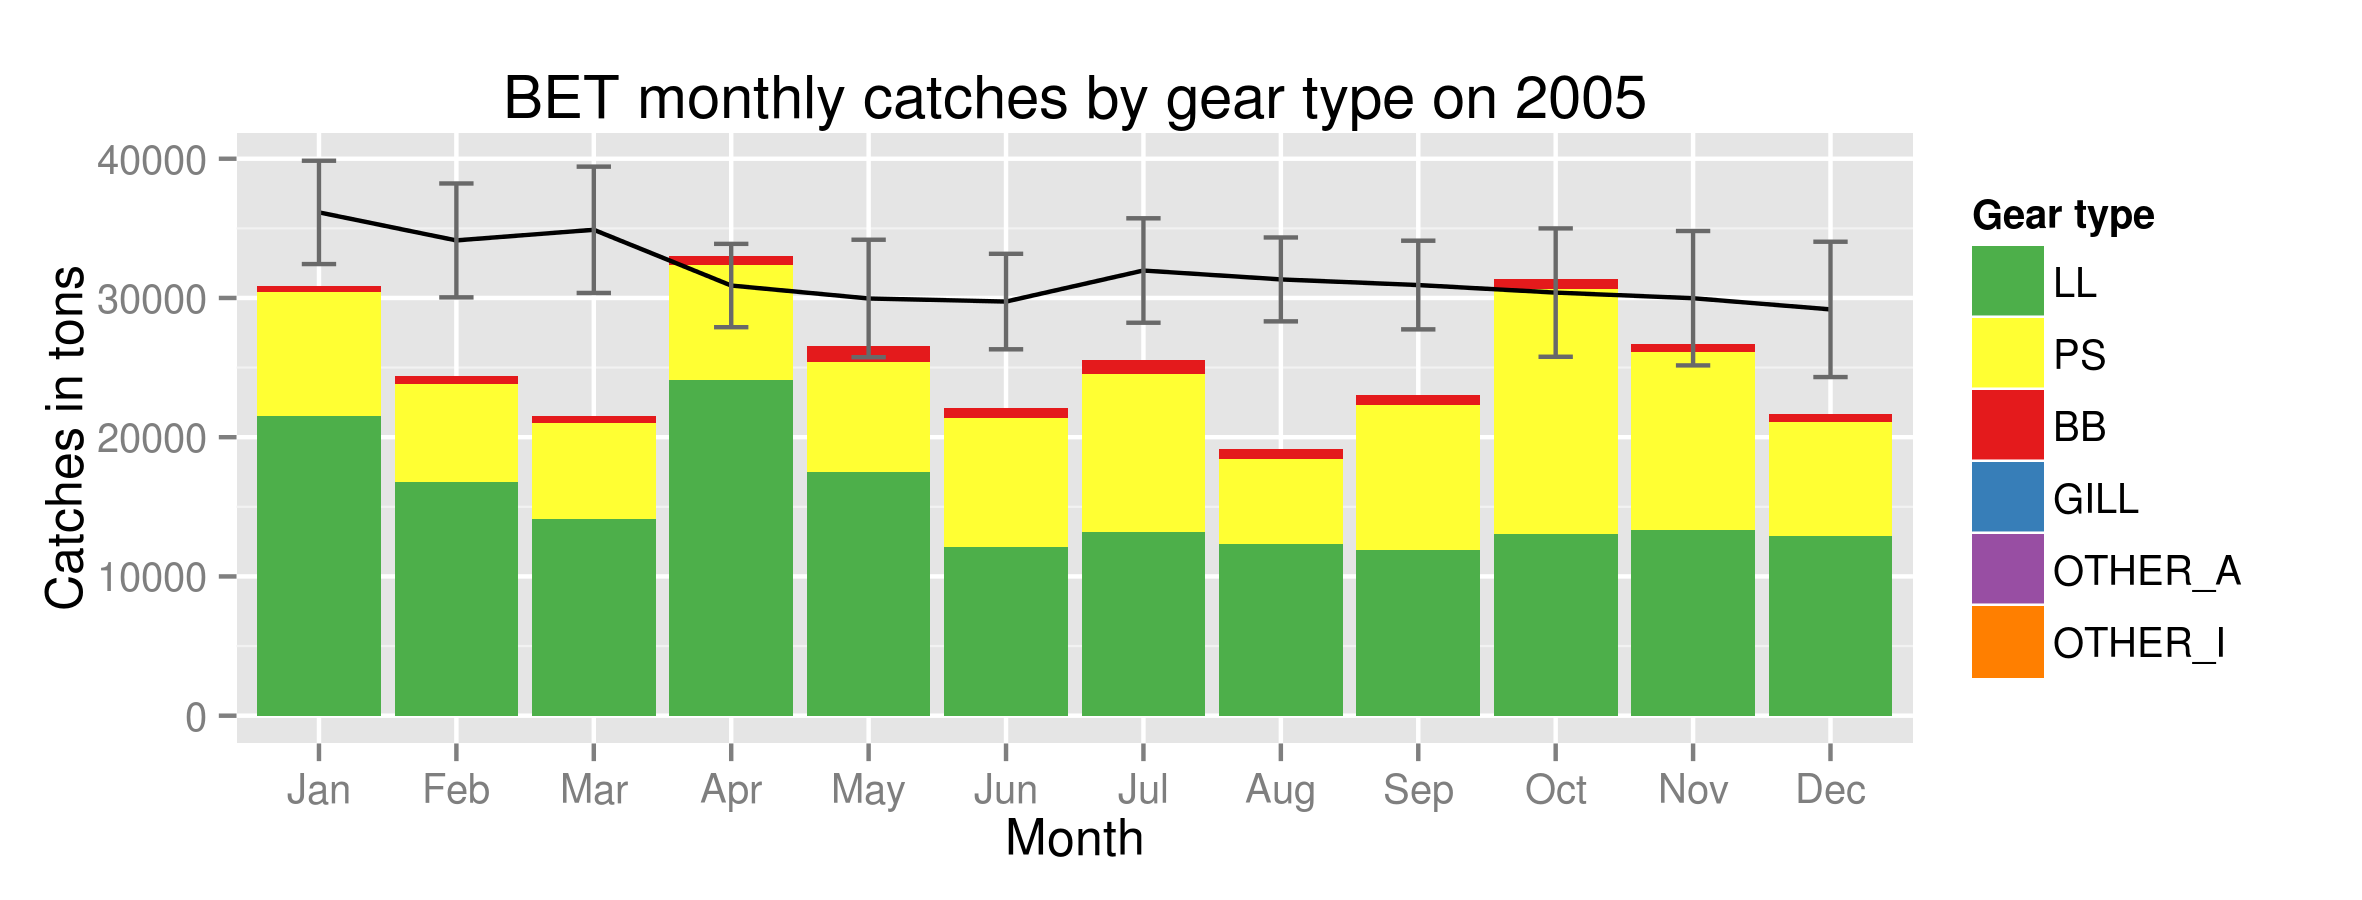
An example of function outputs is provided below (eg Indicator I3 : Catches by gear and by month):
![]() Some of the SQL queries used to extract data are also shared in this github repository.
Some of the SQL queries used to extract data are also shared in this github repository.
Jupyter notebooks
Jupyter notebooks have been set up to help newcomers execute and customize the analysis code. The jupyter notebooks are meant to help users making use of previous R analysis code.
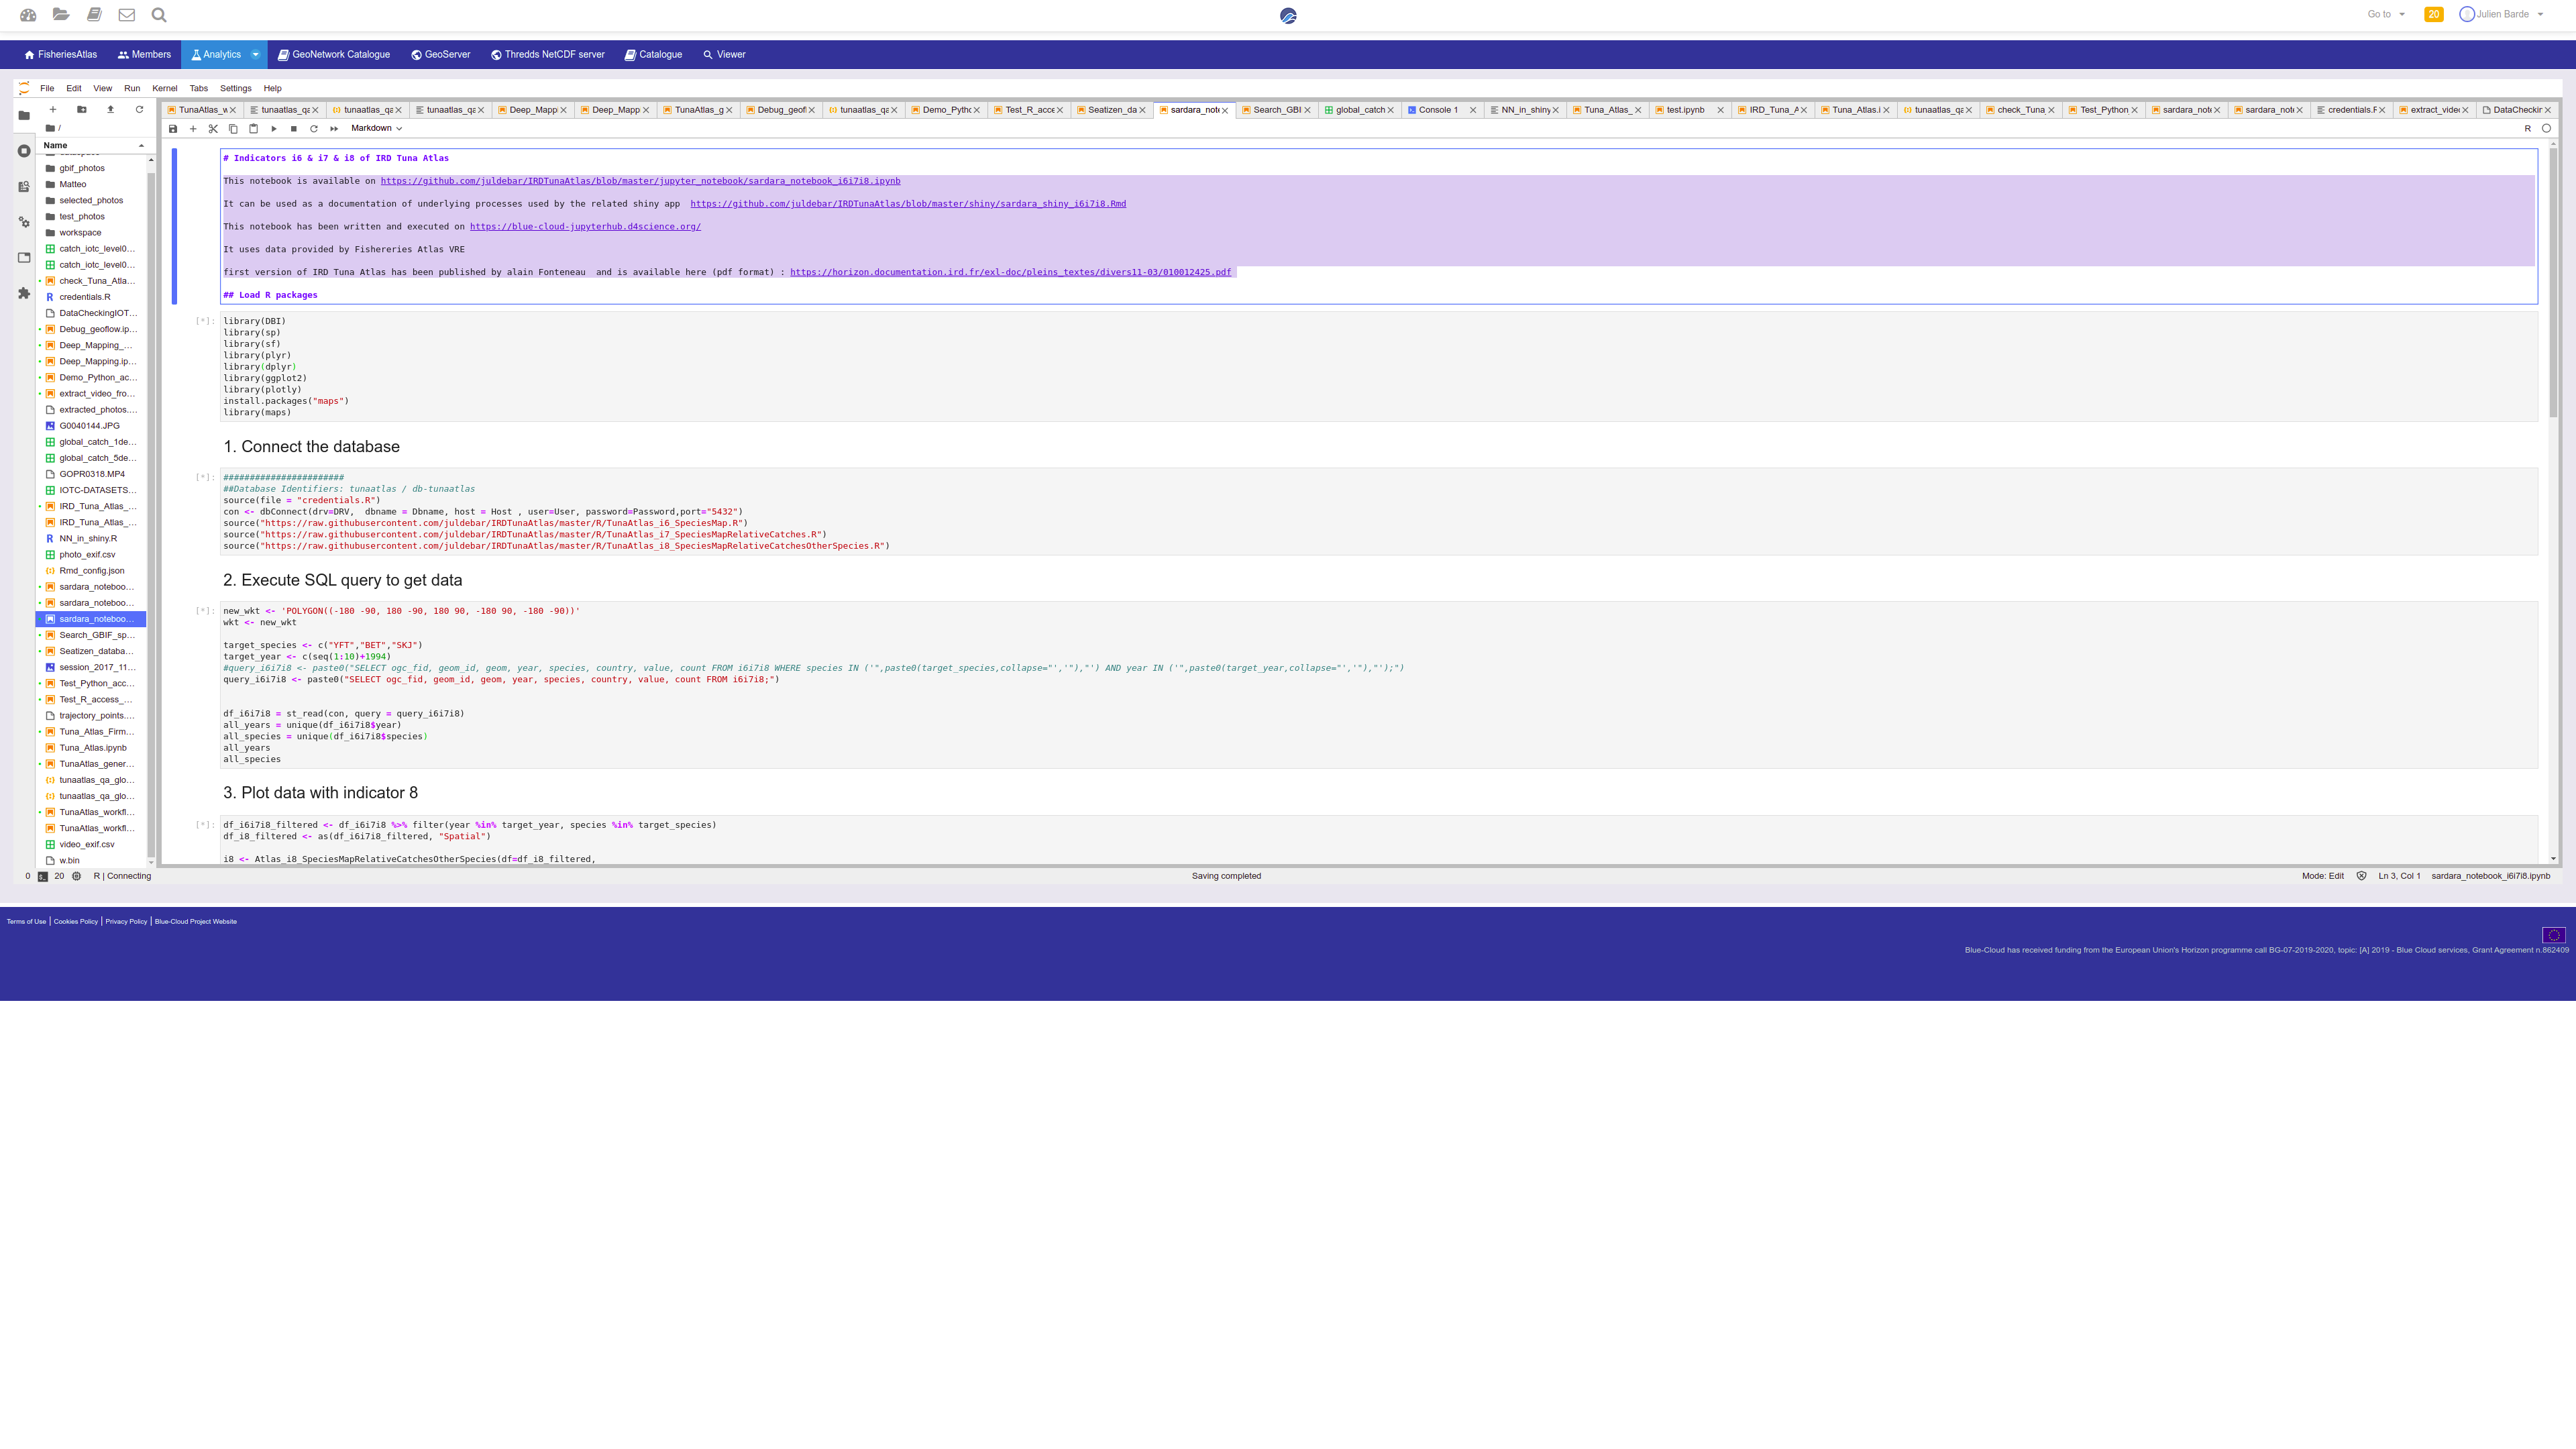
These notebooks are available on this github repo eg Jupyter notebook example for indicators i6, i7 and i8
and have been developped and executed in the Fisheries Atlas VRE which contains a JupyterHub server. A screenshot of a Jupyter notebook is provided below.
![]()
This notebook can be used as a documentation of underlying processes also used by the related shiny app
Shiny apps
Shiny apps have been set up to help newcomers to explore easily the data by using the set of indicators generated by analysis code. Users of shiny apps interested in the code will rather use the related jupyternotebooks than shinyp apps source code.
These Shiny apps have been developped and executed in the Fisheries Atlas VRE which contains a RStudio server for developpers and a shiny proxy server to host these apps. A screenshot of the a Shiny app is provided below.
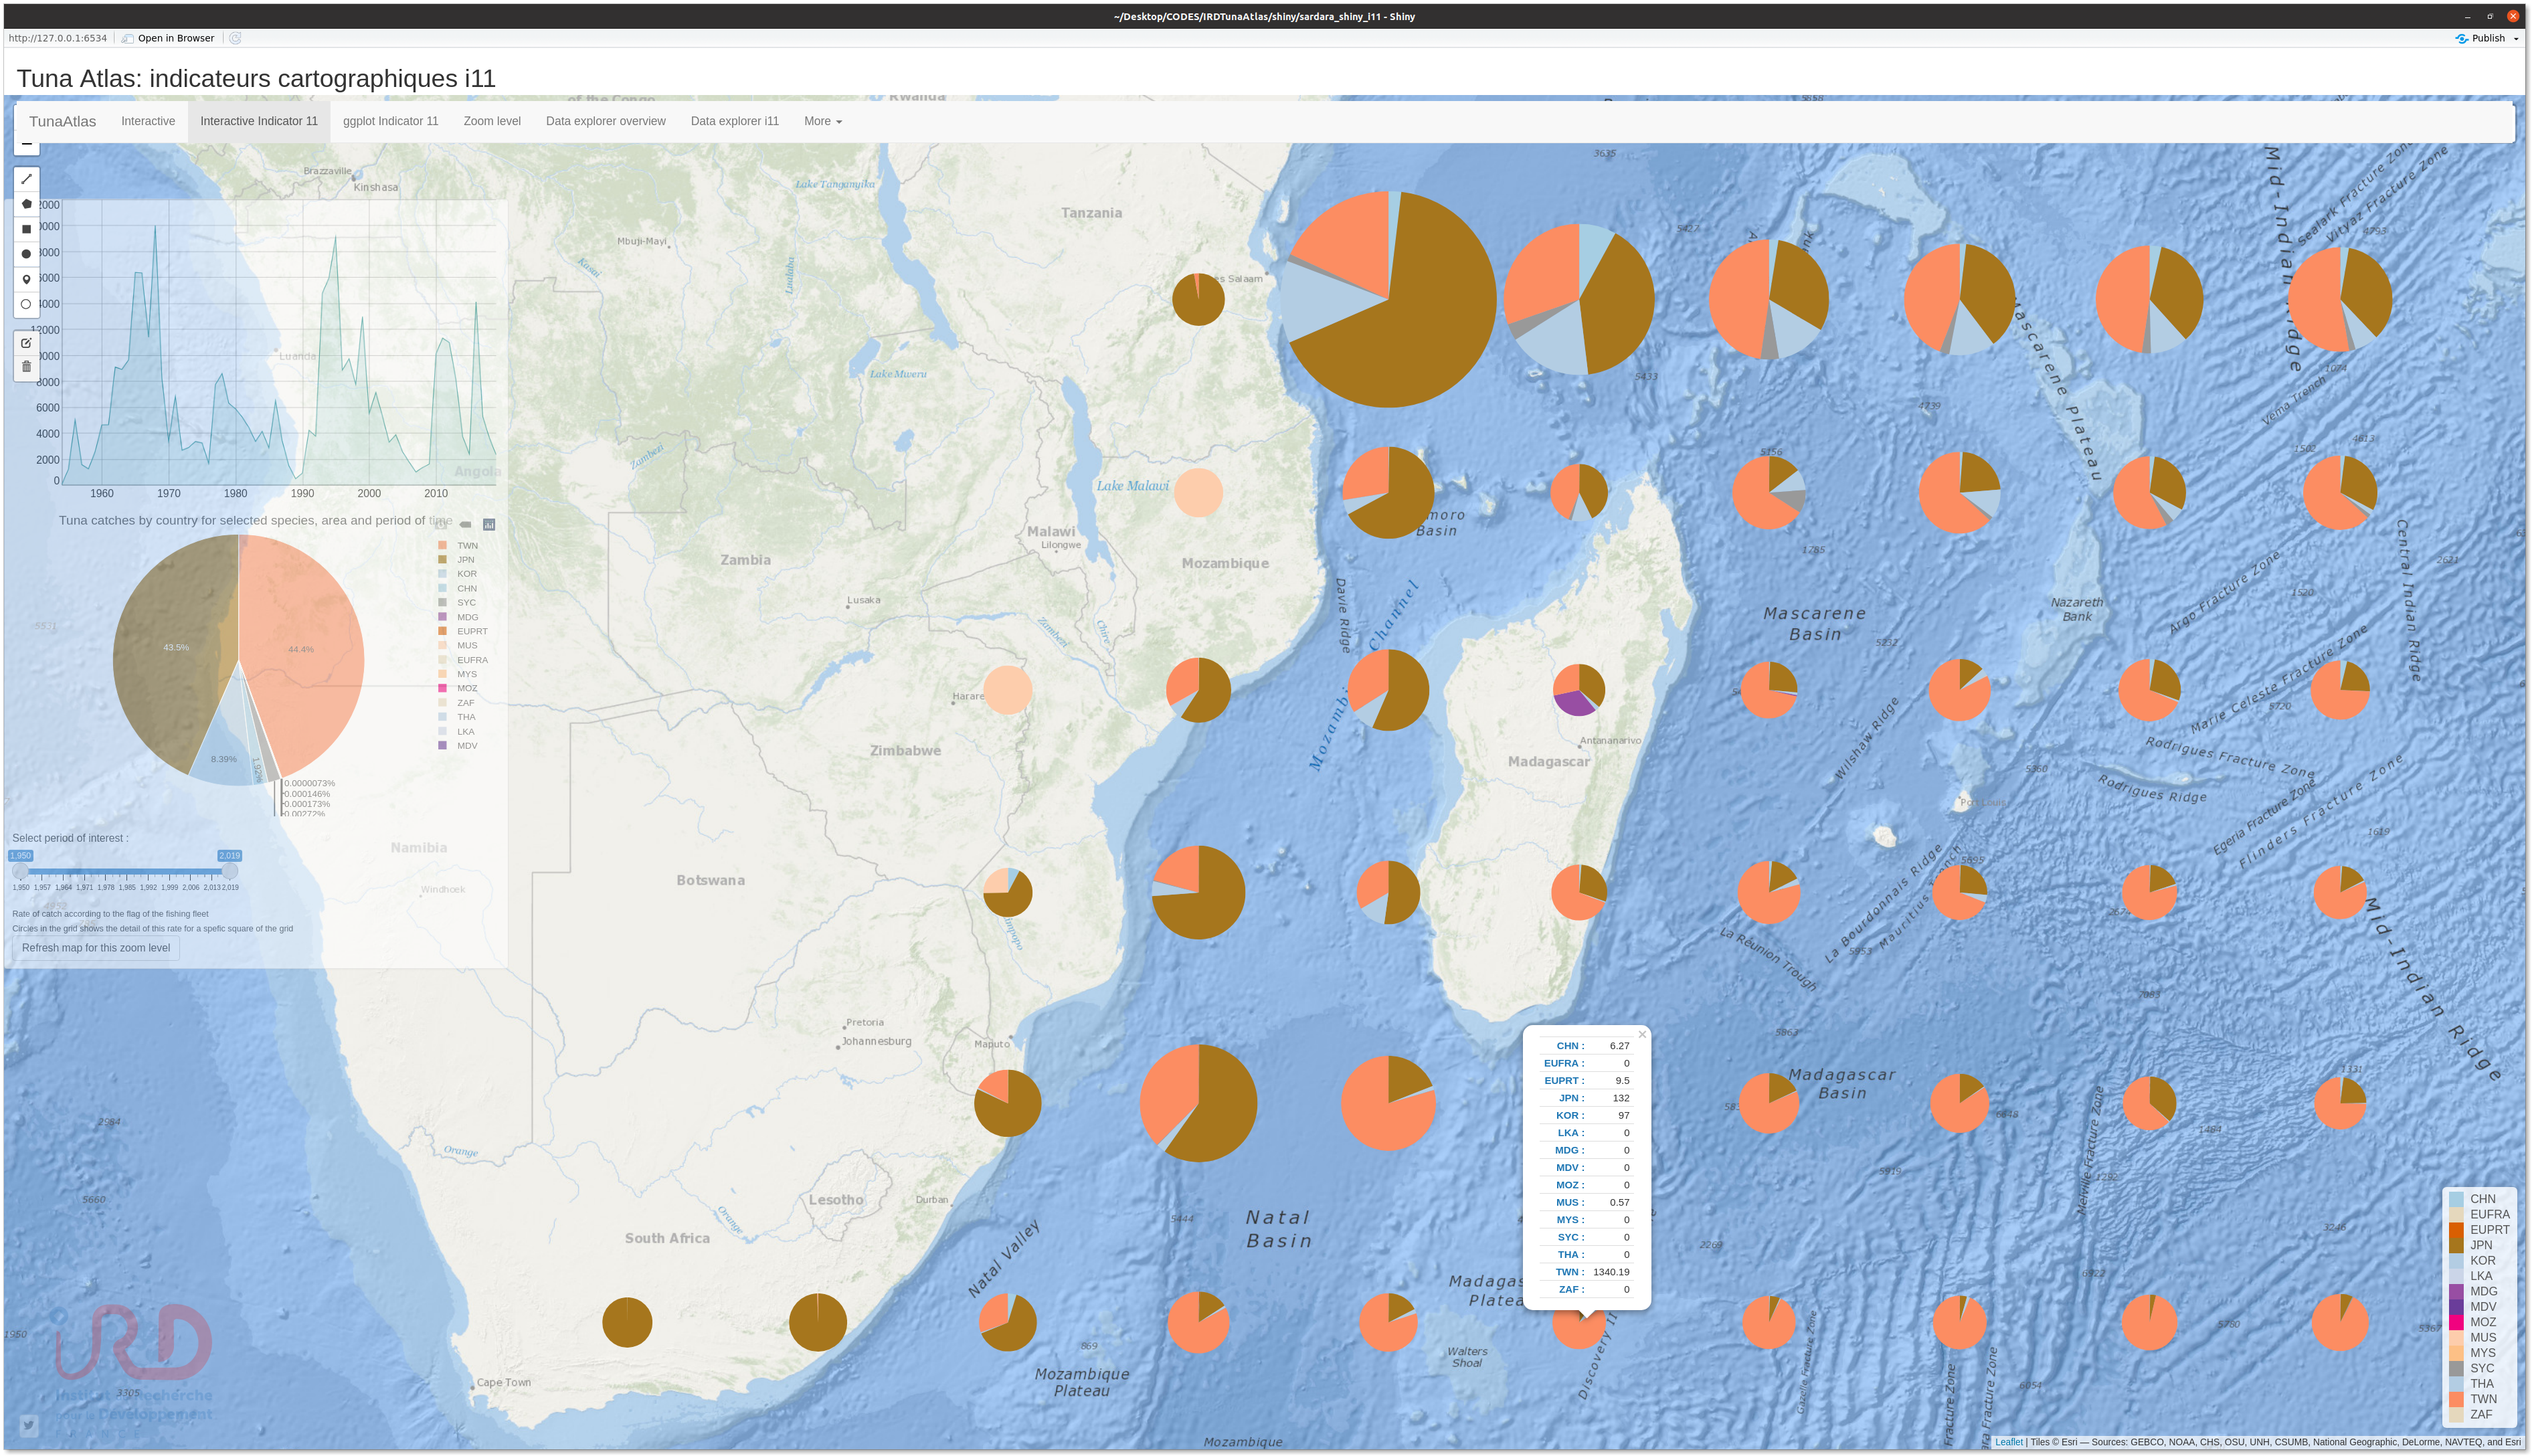
![]()
Updates
The input data are expected to be updated on a yearly basis by FAO and IRD. This update is managed by a set of dedicated scripts:
- IRD legacy SQL code: the persistent storage of data is ensured by a PostgreSQL / Postgis database / multi-dimensionnal data warehouse
-- first version has been set up by Jean Jacques Lechauve in early 2000's
-- a second version has been set up in 2015 by Paul Taconet, Emmanuel Chassot, Julien Barde
- IRD legacy R code: the current R code is mainly coming from
-- a translation in R of previous Fortran code (Alain and Viveca Fonteneau) achived by Julien Trollet
-- the packaging of previous R code within a workflow: Paul Taconet, Emmanuel Chassot, Julien Barde. See Paul Taconet github repositories rtunaatlas and rtunaatlas_scripts
- IRD and FAO/FIRMS Tuna Atlas update to manage previous IRD workflow with geoflow and related package to manage OGC standards (provided by Emmanuel Blondel): see geoflow-tunaatlas
Other resources
Several resources proved invaluable when building this app, including:
- IRD original Tuna Atlas created by Alain Fonteneau.
- The first version of the IRD Tuna Atlas has been published by alain Fonteneau as a pdf document available here ;
Funding
This work received funding from:
- IRD
- iMarine FP7 project
- BlueBridge H2020 project:BlueBRIDGE receives funding from the European Union’s Horizon 2020 research and innovation programme under grant agreement No. 675680
- Blue Cloud H2020 project: Blue-Cloud has received funding from the European Union's Horizon programme call BG-07-2019-2020, topic: [A] 2019 - Blue Cloud services, Grant Agreement n.862409. The views and opinions expressed in this website are the sole responsibility of the author and do not necessarily reflect the views of the European Commission.
Authors
Multiple contributors have been helping building this repository: Julien Barde, Norbert Billet, Emmanuel Chassot, Taha Imzilen, Paul Taconet, UMR MARBEC...
Contact
julien.barde(at)ird.fr
juldebar/IRDTunaAtlas documentation built on March 9, 2024, 3:40 a.m.
R Package Documentation
Browse R Packages
We want your feedback!
Note that we can't provide technical support on individual packages. You should contact the package authors for that.
IRD / UMR MARBEC Tuna Atlas: set of generic indicators for Fisheries datasets
Indicators for Fisheries: use case of the Tuna Atlas
![]()
![]()
See documentation : https://github.com/jsubei/IRDTunaAtlas/wiki
Tuna Atlas interactive maps and charts
This github page contains the code which: - extracts input data from the Tuna Atlas developed jointly by IRD & FAO, - transforms input data to generates maps and plots: R functions or scripts, - packages maps and charts within either dynamic reports, shiny apps, jupyter notebooks...
Input data are obtained from a spatial data infrastructure currently hosted within the Fisheries Atlas VRE of the Blue Cloud H2020 project.
Analysis code
Key elements of the analysis code are a set of indicators originally drafted by Alain Fontenau which were written in R by Norbert Billet and Julien Barde during iMarine FP7 project: - Indicator I1 : Annual catches by ocean – an R script that extracts and reformats time-series stored within a Potgres/Postgis database. The output files are saved in the outputs/www/html/tmp folder. - Indicator I2 : Annual catches by gear - Indicator I3 : Catches by gear and by month - Indicator I4 : Catches by month and by ocean - Indicator I6 : Catches by 5x5 degrees - Indicator I7 : 5x5 degrees relative contribution to catches - Indicator I8 : Catches relative contribution over other species - Indicator I9 : Size frequencies by school type - Indicator I10 : Size frequencies by decade - Indicator I11 : Catches by country
An example of function outputs is provided below (eg Indicator I3 : Catches by gear and by month):
Some of the SQL queries used to extract data are also shared in this github repository.
Jupyter notebooks
Jupyter notebooks have been set up to help newcomers execute and customize the analysis code. The jupyter notebooks are meant to help users making use of previous R analysis code.
These notebooks are available on this github repo eg Jupyter notebook example for indicators i6, i7 and i8 and have been developped and executed in the Fisheries Atlas VRE which contains a JupyterHub server. A screenshot of a Jupyter notebook is provided below.
This notebook can be used as a documentation of underlying processes also used by the related shiny app
Shiny apps
Shiny apps have been set up to help newcomers to explore easily the data by using the set of indicators generated by analysis code. Users of shiny apps interested in the code will rather use the related jupyternotebooks than shinyp apps source code.
These Shiny apps have been developped and executed in the Fisheries Atlas VRE which contains a RStudio server for developpers and a shiny proxy server to host these apps. A screenshot of the a Shiny app is provided below.
Updates
The input data are expected to be updated on a yearly basis by FAO and IRD. This update is managed by a set of dedicated scripts: - IRD legacy SQL code: the persistent storage of data is ensured by a PostgreSQL / Postgis database / multi-dimensionnal data warehouse -- first version has been set up by Jean Jacques Lechauve in early 2000's -- a second version has been set up in 2015 by Paul Taconet, Emmanuel Chassot, Julien Barde - IRD legacy R code: the current R code is mainly coming from -- a translation in R of previous Fortran code (Alain and Viveca Fonteneau) achived by Julien Trollet -- the packaging of previous R code within a workflow: Paul Taconet, Emmanuel Chassot, Julien Barde. See Paul Taconet github repositories rtunaatlas and rtunaatlas_scripts - IRD and FAO/FIRMS Tuna Atlas update to manage previous IRD workflow with geoflow and related package to manage OGC standards (provided by Emmanuel Blondel): see geoflow-tunaatlas
Other resources
Several resources proved invaluable when building this app, including: - IRD original Tuna Atlas created by Alain Fonteneau. - The first version of the IRD Tuna Atlas has been published by alain Fonteneau as a pdf document available here ;
Funding
This work received funding from: - IRD - iMarine FP7 project - BlueBridge H2020 project:BlueBRIDGE receives funding from the European Union’s Horizon 2020 research and innovation programme under grant agreement No. 675680 - Blue Cloud H2020 project: Blue-Cloud has received funding from the European Union's Horizon programme call BG-07-2019-2020, topic: [A] 2019 - Blue Cloud services, Grant Agreement n.862409. The views and opinions expressed in this website are the sole responsibility of the author and do not necessarily reflect the views of the European Commission.
Authors
Multiple contributors have been helping building this repository: Julien Barde, Norbert Billet, Emmanuel Chassot, Taha Imzilen, Paul Taconet, UMR MARBEC...
Contact
julien.barde(at)ird.fr
R Package Documentation
Browse R Packages
We want your feedback!
Note that we can't provide technical support on individual packages. You should contact the package authors for that.
Embedding an R snippet on your website
Add the following code to your website.
For more information on customizing the embed code, read Embedding Snippets.