README.md
In kaigu1990/siGSEA: A simple GSEA tool for expression data
Introduction
An R-package of simplified GSEA. This is my first writing a whole r-package code. The package is only used to simple analyze GSEA with the most default parameters, but the result of siGSEA is similar to official GSEA. The purpose of writing this package is the reason that i feel the R code of GSEA in its web is so old (2005) that i want to rewrite.
Installation
library(devtools)
install_github("kaigu1990/siGSEA")
Quick run
Loading libraries
library(Matrix)
Loading expression file and gene set file (expr data and gene set files are modified test files from GSEA web)
data<- read.table(file = "Gender_test.gct", sep = "\t", header = T, row.names = 1, stringsAsFactors = F, quote = "")
group <- c(rep("m", 15), rep("f", 17))
class <- factor(group)
gene_set <- readLines("C1.gmt")
Running siGSEA
res <- simple_gsea(dataexpr = data,
                   group = class,
                   geneset = gene_set,
                   gsminsize = 15,
                   gsmaxsize = 500,
                   nperm = 1000)
Plot GSEA graph
-
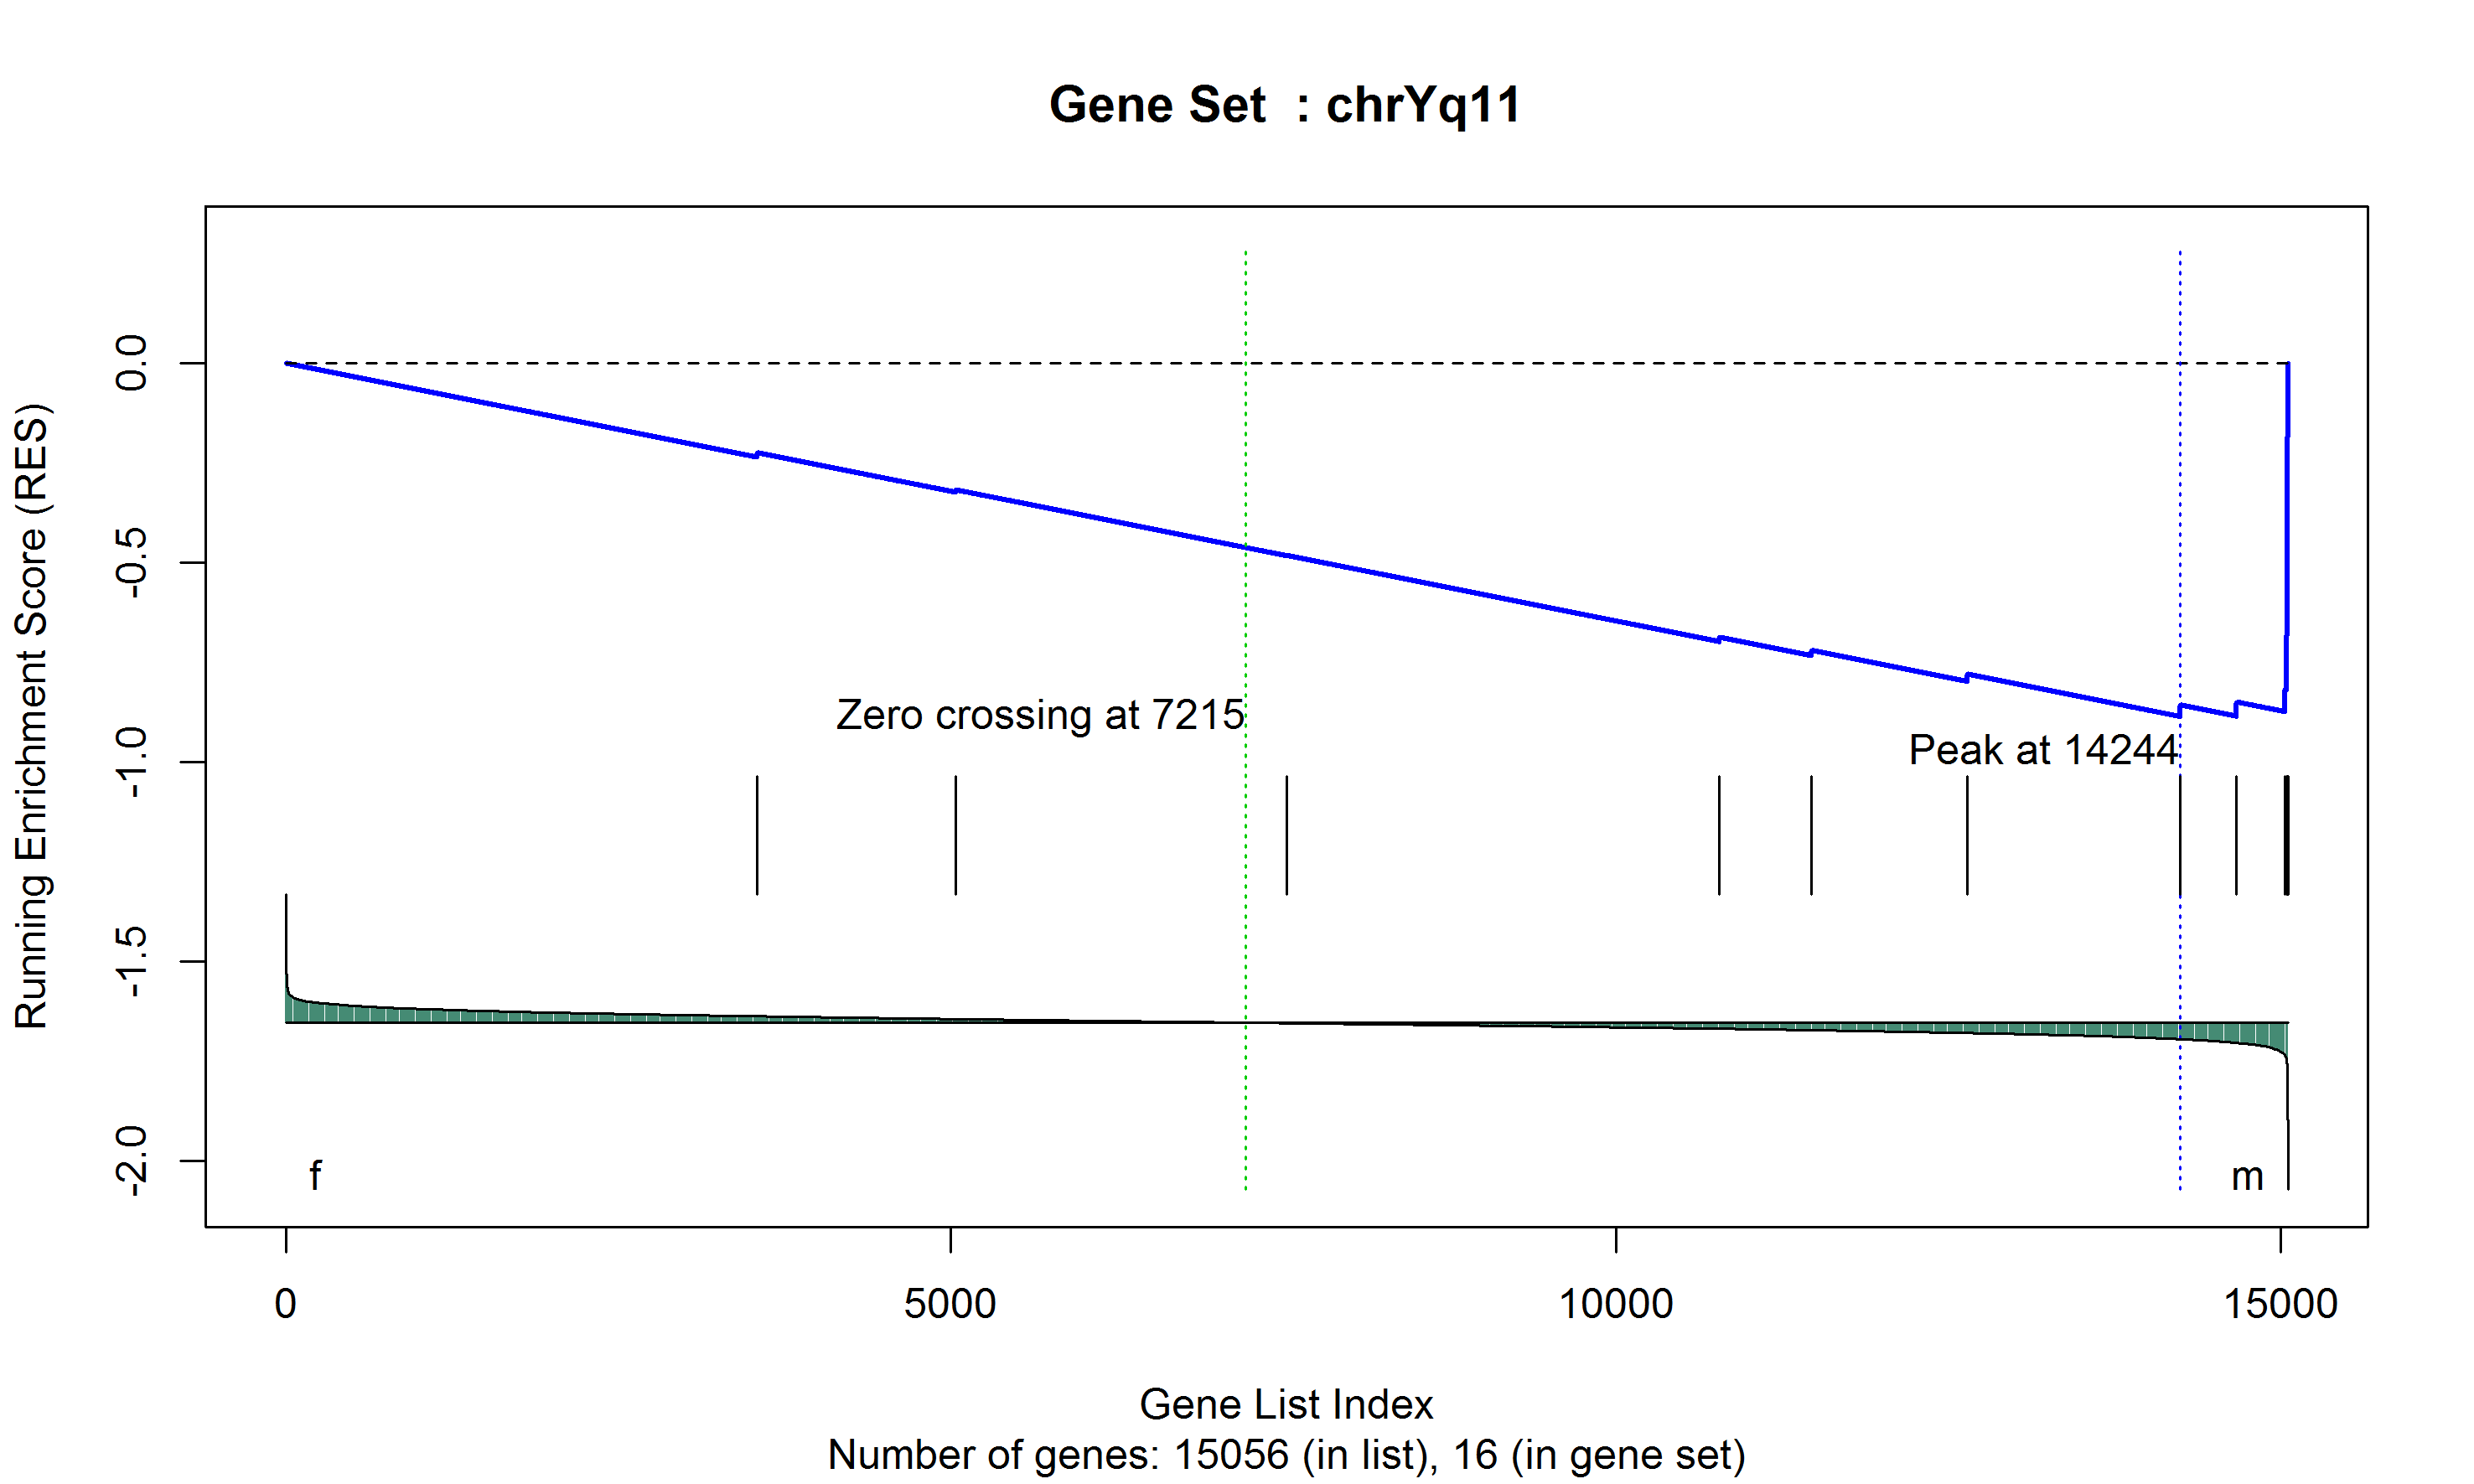
Show a certain gene set
gseaplot(expr = data, list = res, gset = "chr10q11")
-
Output all gene set, such as nompval < 0.05 & FDR < 0.25
gseaplot(expr = data, list = res, gset = NULL, nompval = 0.05, fdr = 0.25)
kaigu1990/siGSEA documentation built on May 3, 2019, 4:04 p.m.
R Package Documentation
Browse R Packages
We want your feedback!
Note that we can't provide technical support on individual packages. You should contact the package authors for that.
Introduction
An R-package of simplified GSEA. This is my first writing a whole r-package code. The package is only used to simple analyze GSEA with the most default parameters, but the result of siGSEA is similar to official GSEA. The purpose of writing this package is the reason that i feel the R code of GSEA in its web is so old (2005) that i want to rewrite.
Installation
library(devtools)
install_github("kaigu1990/siGSEA")
Quick run
Loading libraries
library(Matrix)
Loading expression file and gene set file (expr data and gene set files are modified test files from GSEA web)
data<- read.table(file = "Gender_test.gct", sep = "\t", header = T, row.names = 1, stringsAsFactors = F, quote = "")
group <- c(rep("m", 15), rep("f", 17))
class <- factor(group)
gene_set <- readLines("C1.gmt")
Running siGSEA
res <- simple_gsea(dataexpr = data,
group = class,
geneset = gene_set,
gsminsize = 15,
gsmaxsize = 500,
nperm = 1000)
Plot GSEA graph
-
Show a certain gene set
gseaplot(expr = data, list = res, gset = "chr10q11") -
Output all gene set, such as nompval < 0.05 & FDR < 0.25
gseaplot(expr = data, list = res, gset = NULL, nompval = 0.05, fdr = 0.25)
R Package Documentation
Browse R Packages
We want your feedback!
Note that we can't provide technical support on individual packages. You should contact the package authors for that.
Embedding an R snippet on your website
Add the following code to your website.
For more information on customizing the embed code, read Embedding Snippets.