README.md
In phil8192/ob-analytics: Limit Order Book Analytics
obAnalytics


Limit Order Book event processing and visualisation.
obAnalytics is an R package intended for visualisation and analysis of limit
order data. The package is experimental and is based on the R code used to
create the visualisations in this Limit Order Book Visualisation
article.
Installation
CRAN
install.packages("obAnalytics")
Github
if(!require("devtools")) install.packages("devtools")
devtools::install_github("phil8192/ob-analytics")
Environment settings
Due to the large number of columns in the example data, it is recommended to set
the display width to make the most use of the display. It is also recommended to
set digits.secs=3 and scipen=999 in order to display timestamps and fractions
nicely. This can be achieved as follows:
max.cols <- Sys.getenv("COLUMNS")
options(width=if(max.cols != "") max.cols else 80, scipen=999, digits.secs=3)
Example use
Preprocessed limit order data from the inst/extdata directory has been included
in the package. The data, taken from a Bitcoin exchange on 2015-05-01, consists
of 50,393 limit order events and 482 trades occuring from midnight up until
~5am. To use the data, attach it to the environment:
library(obAnalytics)
data(lob.data)
The lob.data data structure contains 4 data.frames describing limit order
events, trades, depth and summary statistics. All of which are described in
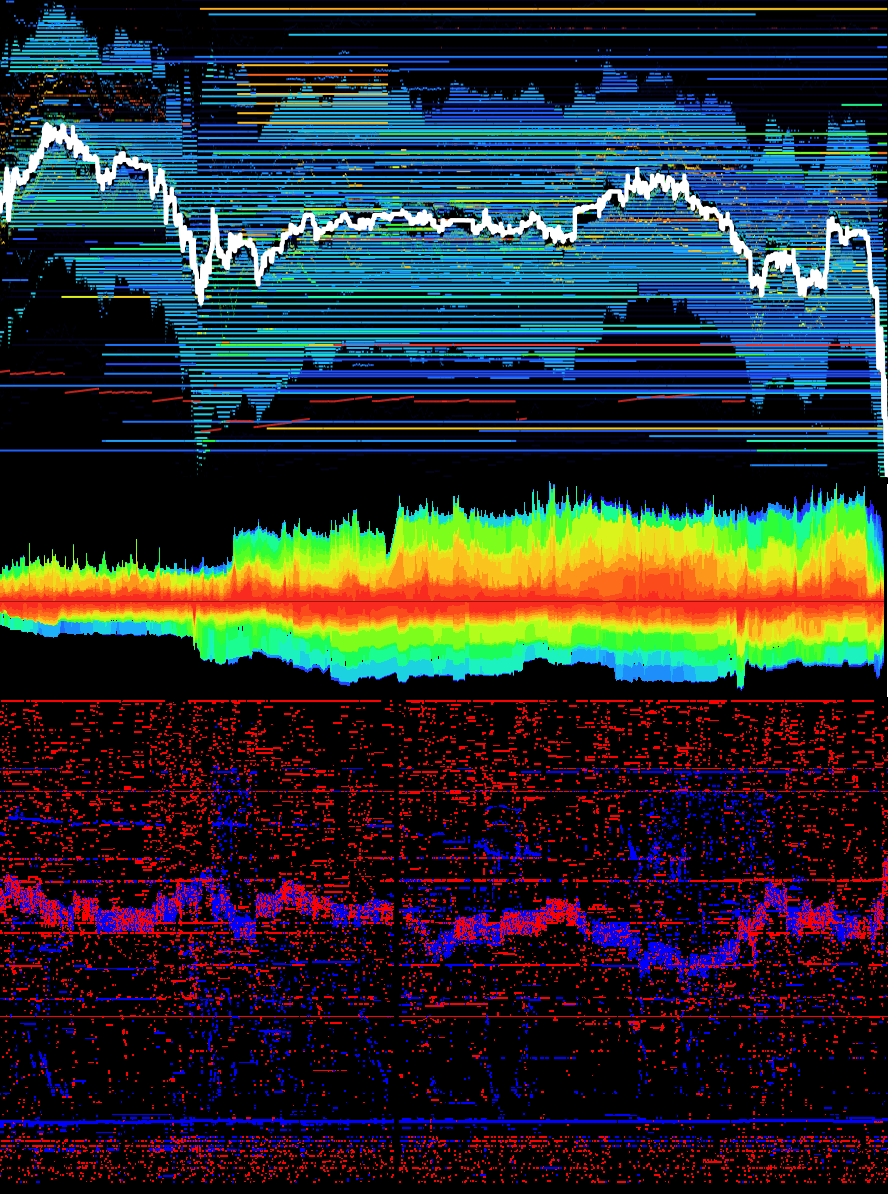
detail in the package documentation. To visualise all of the example order book
data, use the plotPriceLevels function:
with(lob.data, {
  spread <- getSpread(depth.summary)
  plotPriceLevels(depth, spread, volume.scale=10^-8, show.mp=T)
})
Web app
An interactive interface making use of this package is available in the
shiny-ob-analytics respository.
Documentation
Example use documentation has been created in R Markdown (see vignettes)
directory. knitr is used to generate
vignettes. roxygen2 is used to
generate the pdf manual from code comments.
Example use of obAnalytics package (html)
An end-to-end walk-through to demonstrate the main features and functionality of
the package is available here:
http://parasec.net/transmission/ob-analytics/guide.html
Example use (pdf)
http://parasec.net/transmission/ob-analytics/guide.pdf
Manual
In addition to online ?help, package data and function documentation is
available in the form of a manual:
http://parasec.net/transmission/ob-analytics/obAnalytics-manual.pdf
License
GPL (>= 2)
phil8192/ob-analytics documentation built on May 25, 2019, 2:56 a.m.
R Package Documentation
Browse R Packages
We want your feedback!
Note that we can't provide technical support on individual packages. You should contact the package authors for that.
obAnalytics
![]()
Limit Order Book event processing and visualisation.
obAnalytics is an R package intended for visualisation and analysis of limit order data. The package is experimental and is based on the R code used to create the visualisations in this Limit Order Book Visualisation article.
Installation
CRAN
install.packages("obAnalytics")
Github
if(!require("devtools")) install.packages("devtools")
devtools::install_github("phil8192/ob-analytics")
Environment settings
Due to the large number of columns in the example data, it is recommended to set the display width to make the most use of the display. It is also recommended to set digits.secs=3 and scipen=999 in order to display timestamps and fractions nicely. This can be achieved as follows:
max.cols <- Sys.getenv("COLUMNS")
options(width=if(max.cols != "") max.cols else 80, scipen=999, digits.secs=3)
Example use
Preprocessed limit order data from the inst/extdata directory has been included in the package. The data, taken from a Bitcoin exchange on 2015-05-01, consists of 50,393 limit order events and 482 trades occuring from midnight up until ~5am. To use the data, attach it to the environment:
library(obAnalytics)
data(lob.data)
The lob.data data structure contains 4 data.frames describing limit order events, trades, depth and summary statistics. All of which are described in detail in the package documentation. To visualise all of the example order book data, use the plotPriceLevels function:
with(lob.data, {
spread <- getSpread(depth.summary)
plotPriceLevels(depth, spread, volume.scale=10^-8, show.mp=T)
})
Web app
An interactive interface making use of this package is available in the shiny-ob-analytics respository.
Documentation
Example use documentation has been created in R Markdown (see vignettes) directory. knitr is used to generate vignettes. roxygen2 is used to generate the pdf manual from code comments.
Example use of obAnalytics package (html)
An end-to-end walk-through to demonstrate the main features and functionality of the package is available here: http://parasec.net/transmission/ob-analytics/guide.html
Example use (pdf)
http://parasec.net/transmission/ob-analytics/guide.pdf
Manual
In addition to online ?help, package data and function documentation is available in the form of a manual: http://parasec.net/transmission/ob-analytics/obAnalytics-manual.pdf
License
GPL (>= 2)
R Package Documentation
Browse R Packages
We want your feedback!
Note that we can't provide technical support on individual packages. You should contact the package authors for that.
Embedding an R snippet on your website
Add the following code to your website.
For more information on customizing the embed code, read Embedding Snippets.