In radiant-rstats/radiant.data: Data Menu for Radiant: Business Analytics using R and Shiny
Summarize and explore your data
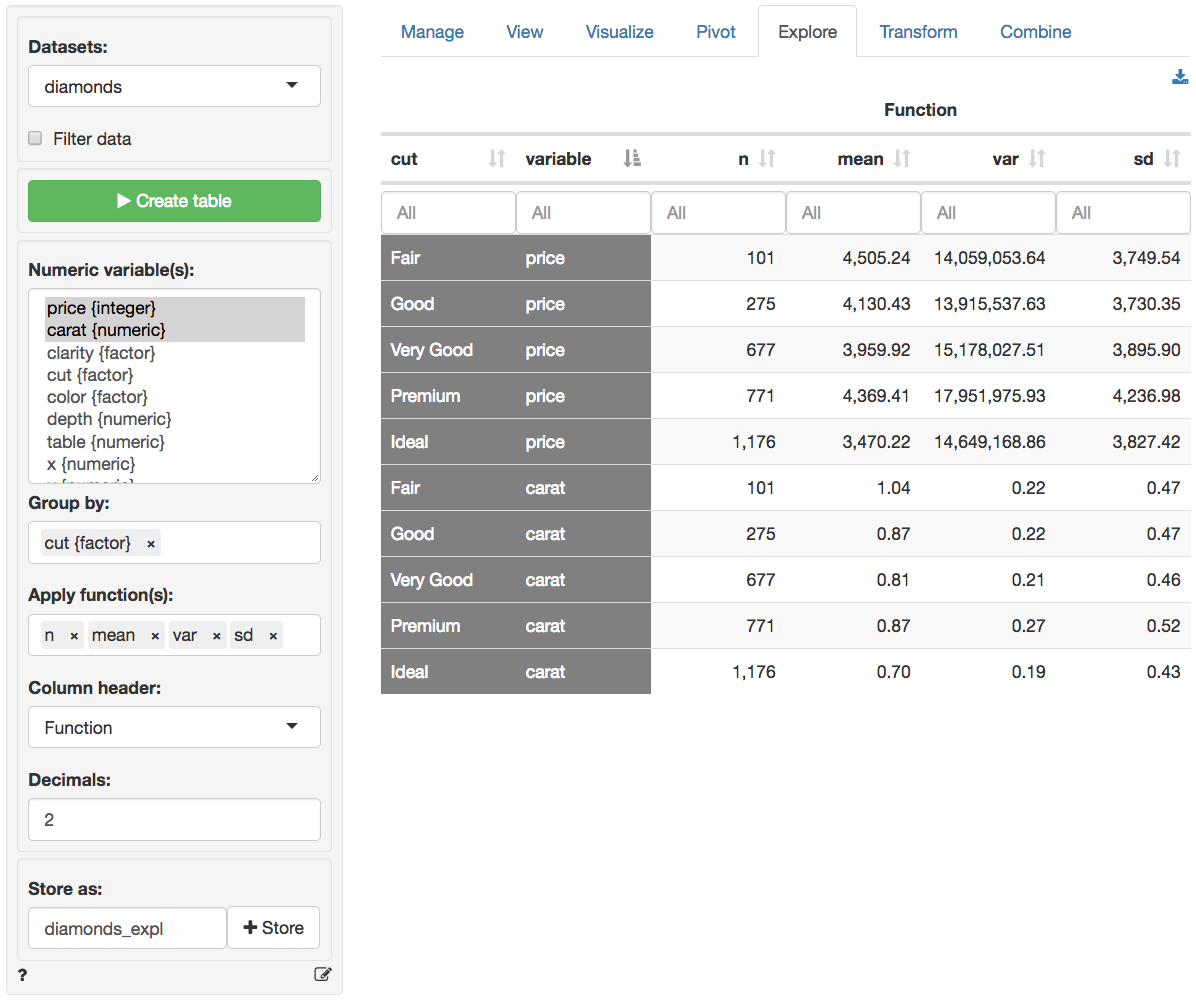
Generate summary statistics for one or more variables in your data. The most powerful feature in Data > Explore is that you can easily describe the data by one or more other variables. Where the Data > Pivot tab works best for frequency tables and to summarize a single numeric variable, the Data > Explore tab allows you to summarize multiple variables at the same time using various statistics.
For example, if we select price from the diamonds dataset and click the Create table button we can see the number of observations (n), the mean, the variance, etc. However, the mean price for each clarity level of the diamond can also be easily provided by choosing clarity as the Group by variable.
Note that when a categorical variable (factor) is selected from the Numeric variable(s) dropdown menu it will be converted to a numeric variable if required for the selected function. If the factor levels are numeric these will be used in all calculations. Since the mean, standard deviation, etc. are not relevant for non-binary categorical variables, these will be converted to 0-1 (binary) variables where the first level is coded as 1 and all other levels as 0.
The created summary table can be stored in Radiant by clicking the Store button. This can be useful if you want to create plots of the summarized data in Data > Visualize. To download the table to csv format click the download icon on the top-right.
You can select options from Column header dropdown to switch between different column headers. Select either Function (e.g., mean, median, etc), Variable (e.g., price, carat, etc), or the levels of the (first) Group by variable (e.g., Fair-Ideal).
Functions
Below you will find a brief description of several functions available from the Apply function(s) dropdown menu. Most functions, however, will be self-explanatory.
n calculates the number of observations, or rows, in the data or in a group if a Group by variable has been selected (n uses the length function in R)n_distinct calculates the number of distinct valuesn_missing calculates the number of missing valuescv is the coefficient of variation (i.e., mean(x) / sd(x))sd and var calculate the sample standard deviation and variance for numeric datame calculates the margin of error for a numeric variable using a 95% confidence levelprop calculates a proportion. For a variable with only values 0 or 1 this is equivalent to mean. For other numeric variables it captures the occurrence of the maximum value.
For a factor it captures the occurrence of the first level. sdprop and varprop calculate the sample standard deviation and variance for a proportionmeprop calculates the margin of error for a proportion using a 95% confidence levelsdpop and varpop calculate the population standard deviation and variance
Filter data
Use the Filter data box to select (or omit) specific sets of rows from the data. See the helpfile for Data > View for details.
Report > Rmd
Add code to Report > Rmd to (re)create the summary table by clicking the icon on the bottom left of your screen or by pressing ALT-enter on your keyboard.
R-functions
For an overview of related R-functions used by Radiant to summarize and explore data see Data > Explore
radiant-rstats/radiant.data documentation built on Jan. 19, 2024, 12:21 p.m.
R Package Documentation
Browse R Packages
We want your feedback!
Note that we can't provide technical support on individual packages. You should contact the package authors for that.
Summarize and explore your data
Generate summary statistics for one or more variables in your data. The most powerful feature in Data > Explore is that you can easily describe the data by one or more other variables. Where the Data > Pivot tab works best for frequency tables and to summarize a single numeric variable, the Data > Explore tab allows you to summarize multiple variables at the same time using various statistics.
For example, if we select price from the diamonds dataset and click the Create table button we can see the number of observations (n), the mean, the variance, etc. However, the mean price for each clarity level of the diamond can also be easily provided by choosing clarity as the Group by variable.
Note that when a categorical variable (
factor) is selected from theNumeric variable(s)dropdown menu it will be converted to a numeric variable if required for the selected function. If the factor levels are numeric these will be used in all calculations. Since the mean, standard deviation, etc. are not relevant for non-binary categorical variables, these will be converted to 0-1 (binary) variables where the first level is coded as 1 and all other levels as 0.
The created summary table can be stored in Radiant by clicking the Store button. This can be useful if you want to create plots of the summarized data in Data > Visualize. To download the table to csv format click the download icon on the top-right.
You can select options from Column header dropdown to switch between different column headers. Select either Function (e.g., mean, median, etc), Variable (e.g., price, carat, etc), or the levels of the (first) Group by variable (e.g., Fair-Ideal).
Functions
Below you will find a brief description of several functions available from the Apply function(s) dropdown menu. Most functions, however, will be self-explanatory.
ncalculates the number of observations, or rows, in the data or in a group if aGroup byvariable has been selected (nuses thelengthfunction in R)n_distinctcalculates the number of distinct valuesn_missingcalculates the number of missing valuescvis the coefficient of variation (i.e., mean(x) / sd(x))sdandvarcalculate the sample standard deviation and variance for numeric datamecalculates the margin of error for a numeric variable using a 95% confidence levelpropcalculates a proportion. For a variable with only values 0 or 1 this is equivalent tomean. For other numeric variables it captures the occurrence of the maximum value. For afactorit captures the occurrence of the first level.sdpropandvarpropcalculate the sample standard deviation and variance for a proportionmepropcalculates the margin of error for a proportion using a 95% confidence levelsdpopandvarpopcalculate the population standard deviation and variance
Filter data
Use the Filter data box to select (or omit) specific sets of rows from the data. See the helpfile for Data > View for details.
Report > Rmd
Add code to Report > Rmd to (re)create the summary table by clicking the icon on the bottom left of your screen or by pressing ALT-enter on your keyboard.
R-functions
For an overview of related R-functions used by Radiant to summarize and explore data see Data > Explore
R Package Documentation
Browse R Packages
We want your feedback!
Note that we can't provide technical support on individual packages. You should contact the package authors for that.
Embedding an R snippet on your website
Add the following code to your website.
For more information on customizing the embed code, read Embedding Snippets.