In stefvanbuuren/jamestest: App to interact with the JAMES chart site
knitr::opts_chunk$set(echo = TRUE, eval=FALSE)
jamesdemo
The jamesdemo package contains a simple Shiny app that shows site functionality of the Joint Automatic Measurement and Evaluation System (JAMES). The API endpoint request_site as defined by james returns an URL that points to a site with personalised child charts. The jamesdemo app shows the site for a set of demo children. The jamesdemodata package stores the data of these children.
Installation
The following statements will install the jamesdemo package
install.packages("remotes")
remotes::install_github("growthcharts/jamesdemo")
Example
Within RStudio, view the website locally as follows:
library(jamesdemo)
go()
The app does not run in the internal RStudio viewer. Click on button Open in browser to see it in action.
Online version
You can spare yourself the trouble of installing the package, and visit
JAMES tryout at https://tnochildhealthstatistics.shinyapps.io/james_tryout/.
Some guidelines using the app
Interaction within the app should explain itself, but a few things may not be obvious at first.
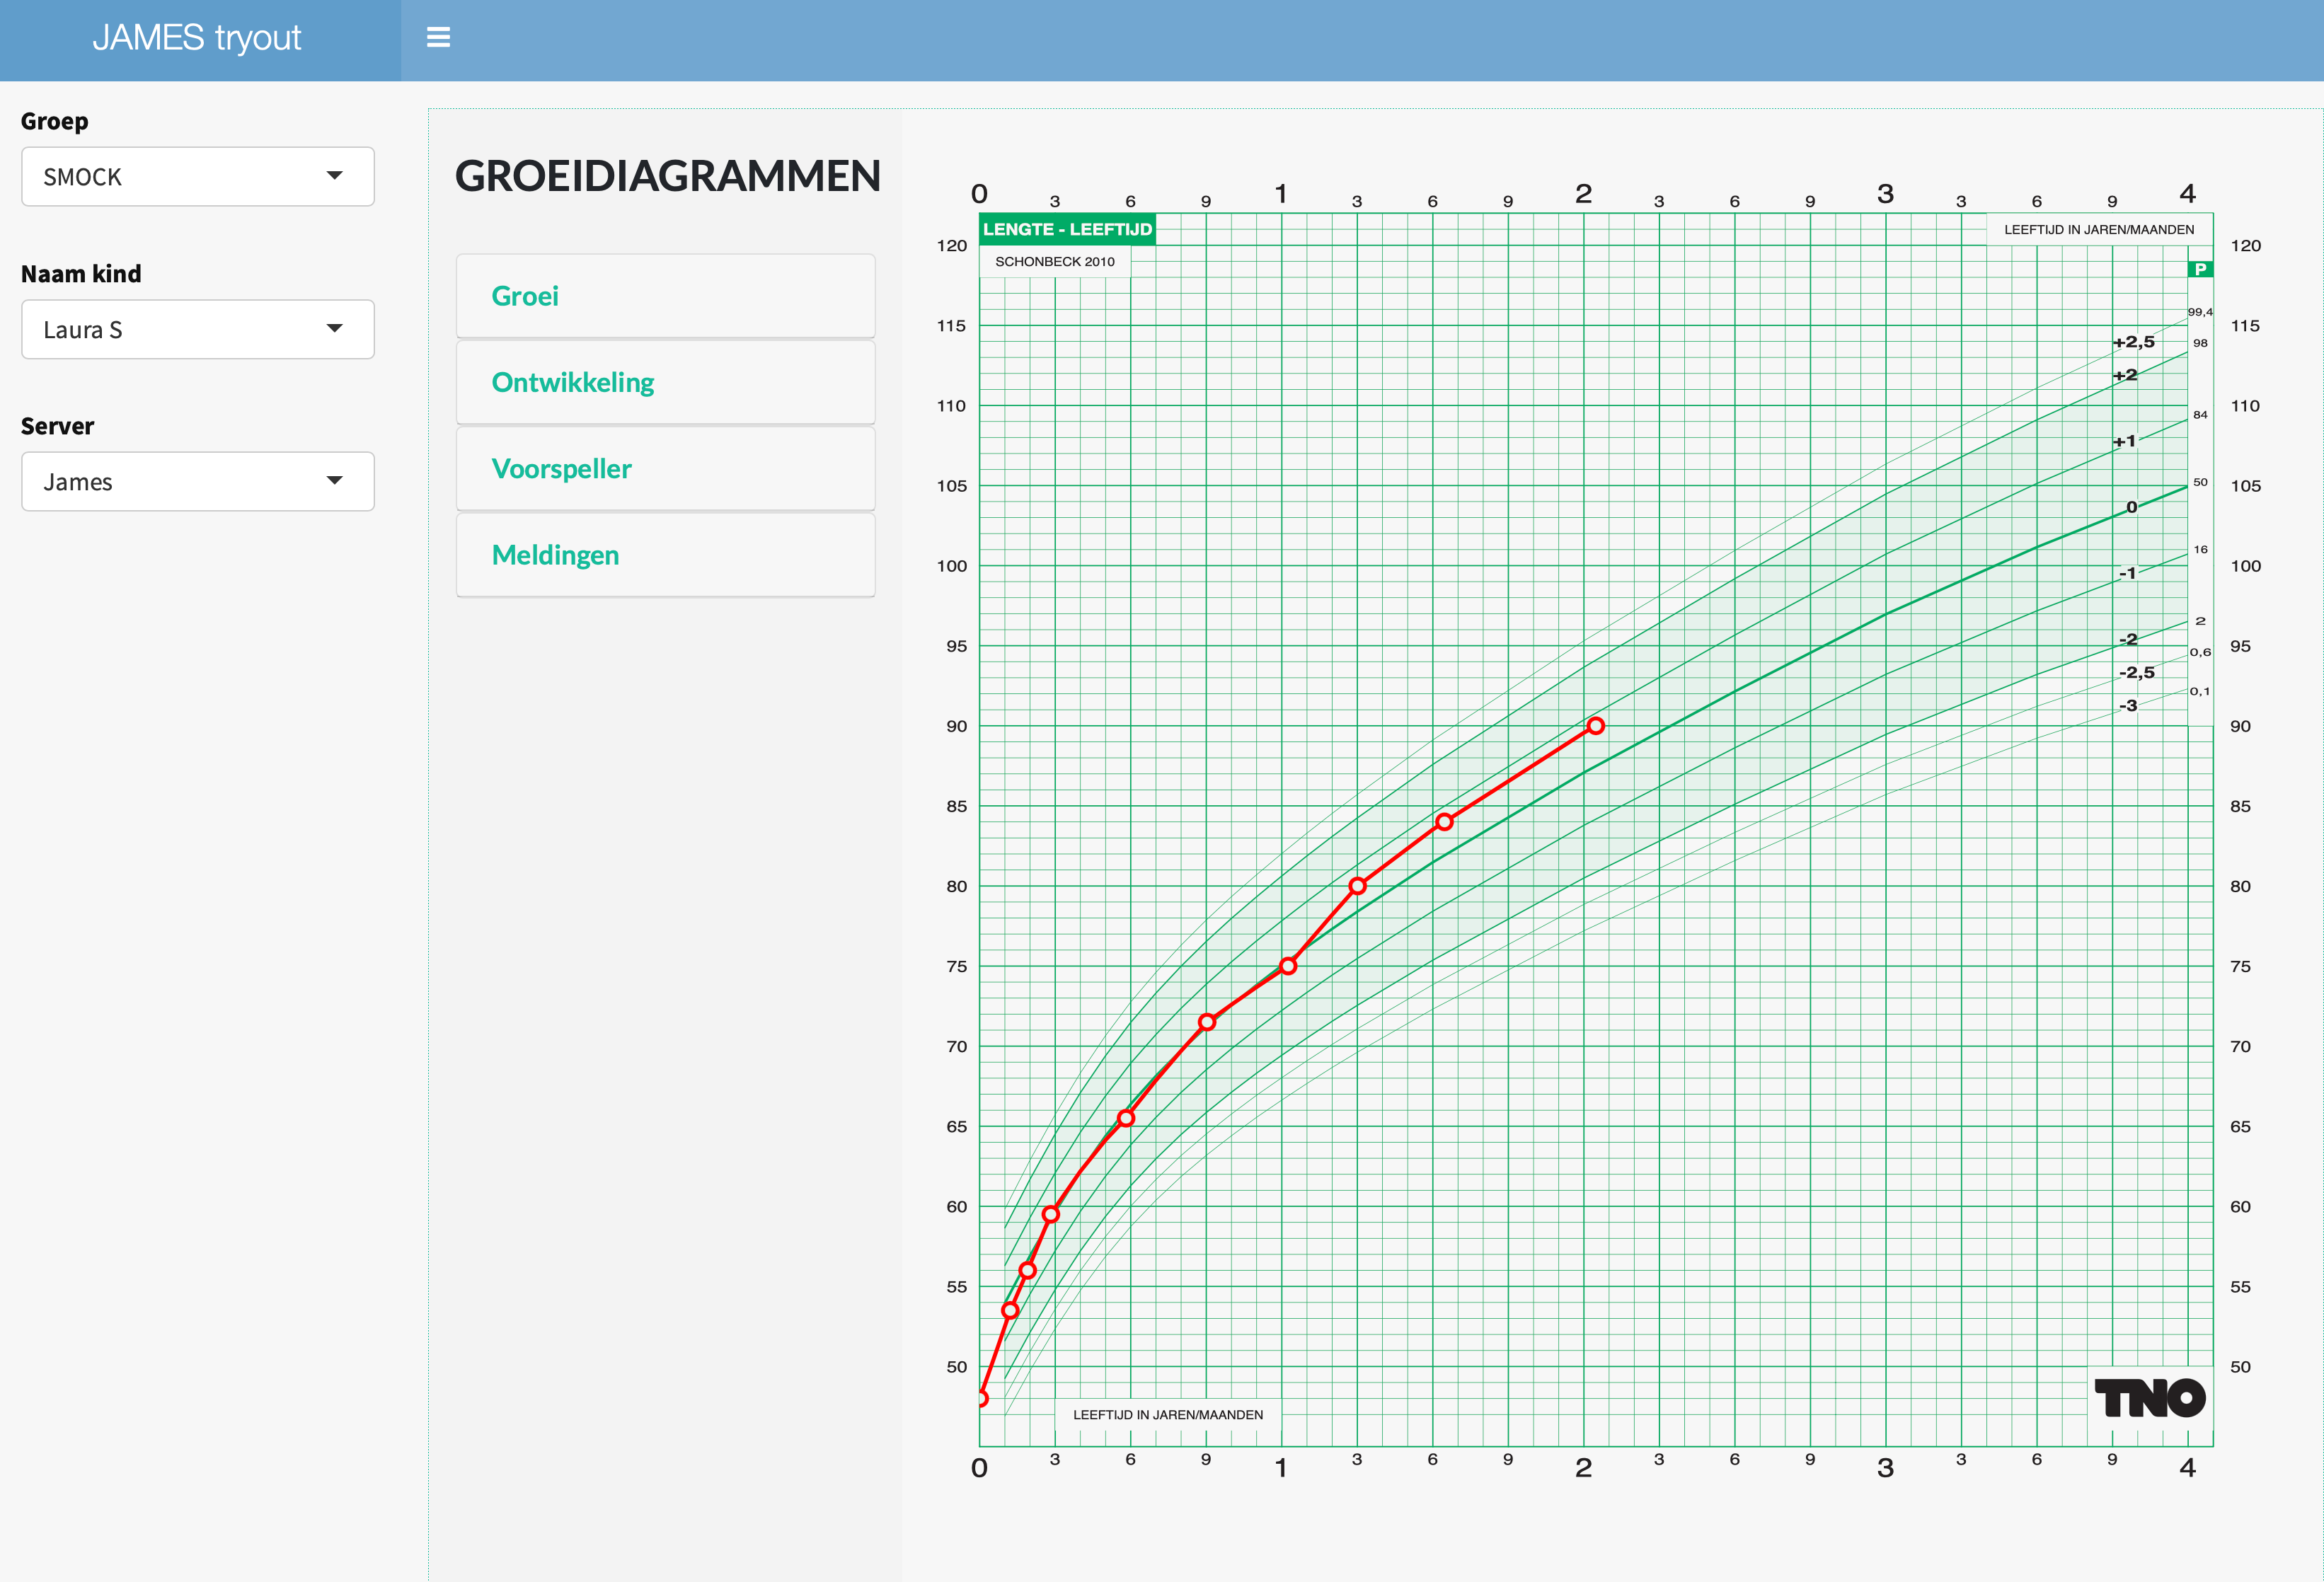
There are two control bars at the left. The leftmost bar with Groep, Naam kind and Server belongs to the jamesdemo Shiny app and mimics the external client with a database with the children's data. The Server menu allows setting one of three servers:
- JAMES: the production server at https://james.groeidiagrammen.nl. This should always work, and is the default;
- localhost: the local server. For development. Works only if you are running the app locally and if the relevant JAMES container is running locally under docker.
Everything within the panel GROEIDIAGRAMMEN is produced by JAMES. The middle bar with Groei contains interactive controls managed by the JAMES API, in particular by function james::request_site(). The right hand side figure, with the chart, is responsive to changes made in the middle bar and is also part of JAMES.
For developers: You may request the entire site in your application (as shown here), but it is also possible to just call individual elements, and build the user interaction yourself.
Resources
stefvanbuuren/jamestest documentation built on June 29, 2023, 6:58 a.m.
R Package Documentation
Browse R Packages
We want your feedback!
Note that we can't provide technical support on individual packages. You should contact the package authors for that.
knitr::opts_chunk$set(echo = TRUE, eval=FALSE)
jamesdemo
The jamesdemo package contains a simple Shiny app that shows site functionality of the Joint Automatic Measurement and Evaluation System (JAMES). The API endpoint request_site as defined by james returns an URL that points to a site with personalised child charts. The jamesdemo app shows the site for a set of demo children. The jamesdemodata package stores the data of these children.
Installation
The following statements will install the jamesdemo package
install.packages("remotes") remotes::install_github("growthcharts/jamesdemo")
Example
Within RStudio, view the website locally as follows:
library(jamesdemo) go()
The app does not run in the internal RStudio viewer. Click on button Open in browser to see it in action.
Online version
You can spare yourself the trouble of installing the package, and visit
JAMES tryout at https://tnochildhealthstatistics.shinyapps.io/james_tryout/.
Some guidelines using the app
Interaction within the app should explain itself, but a few things may not be obvious at first.
There are two control bars at the left. The leftmost bar with Groep, Naam kind and Server belongs to the jamesdemo Shiny app and mimics the external client with a database with the children's data. The Server menu allows setting one of three servers:
- JAMES: the production server at https://james.groeidiagrammen.nl. This should always work, and is the default;
- localhost: the local server. For development. Works only if you are running the app locally and if the relevant JAMES container is running locally under docker.
Everything within the panel GROEIDIAGRAMMEN is produced by JAMES. The middle bar with Groei contains interactive controls managed by the JAMES API, in particular by function james::request_site(). The right hand side figure, with the chart, is responsive to changes made in the middle bar and is also part of JAMES.
For developers: You may request the entire site in your application (as shown here), but it is also possible to just call individual elements, and build the user interaction yourself.
Resources
R Package Documentation
Browse R Packages
We want your feedback!
Note that we can't provide technical support on individual packages. You should contact the package authors for that.
Embedding an R snippet on your website
Add the following code to your website.
For more information on customizing the embed code, read Embedding Snippets.