README.md
In swihart/aaroseplot: Area Adjusted Roseplots via ggplot2
aaroseplot
The prefix "aa" stands for "area adjusted".
aaroseplot is an R package/repo providing an attempt to assuage the
"major preceptual problems" of roseplots listed in the note of
ggplot2:coord_polar:
NOTE: Use these plots with caution - polar coordinates has
major perceptual problems.  The main point of these examples is
to demonstrate how these common plots can be described in the
grammar.  Use with EXTREME caution.
When a barchart is converted to a roseplot, the height of the bar
becomes the radius of the "wedge". This is problematic perceptually
because the relation between the shaded areas of barchart does not
persist to a roseplot. For example, if two bars have equal width but
one's height is 4x as tall, then the fill-area is 4x as much as
well. However, if a wedge has 4x the radius, its fill-area is 16x as much as
the referent wedge area. The trick is to have the height of the bar
in the bar chart become the area (not the radius) of the roseplot -- thus the area of a traditional roseplot is adjusted: hence the name
area adjusted roseplot.
Can I just see what you're talking about?
Run in R:
#install.packages("devtools")
library(devtools)
install_github("hadley/ggplot2")
install_github("swihart/aaroseplot")
library(aaroseplot)
data(prob.cond.region)
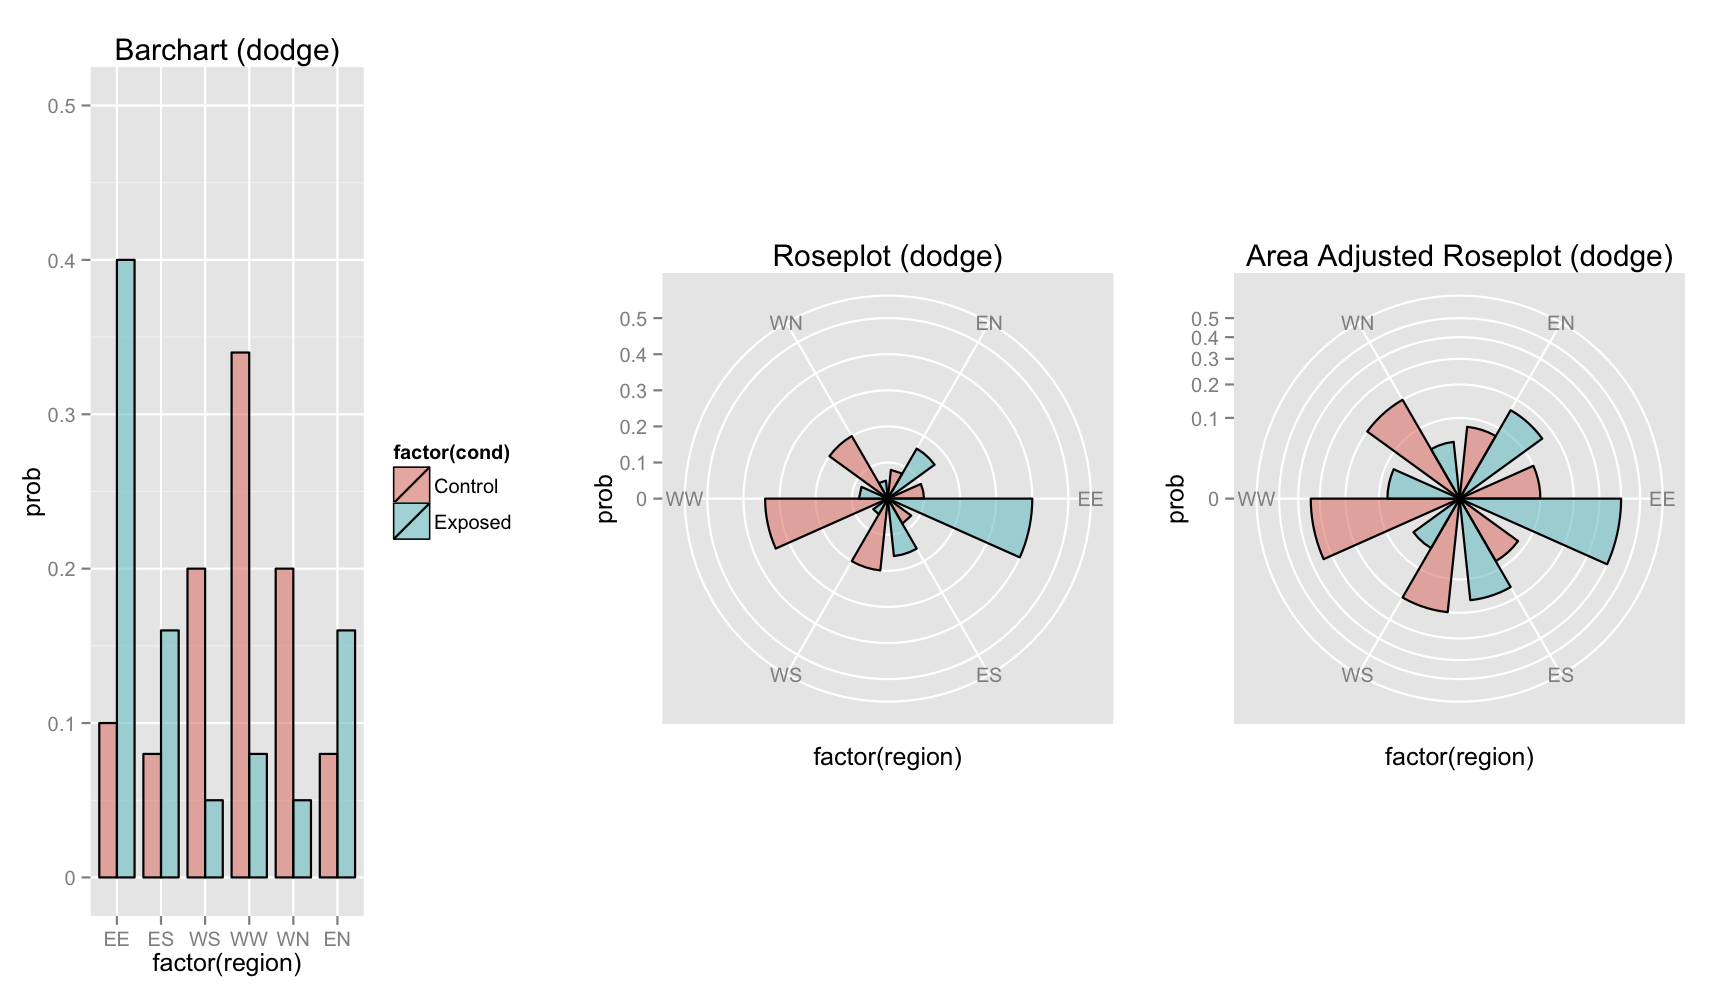
## Dodged barchart, roseplot, area adjusted roseplot
be <- barchart(prob.cond.region, "dodge", rad.max=0.5) + ggtitle("Barchart (dodge)")
re <- roseplot(prob.cond.region, "dodge", rad.max=0.5) + ggtitle("Roseplot (dodge)") + scale_fill_discrete(guide="none")
ae <- aaroseplot(prob.cond.region, "dodge", rad.max=0.5) + ggtitle("Area Adjusted Roseplot (dodge)") + scale_fill_discrete(guide="none")
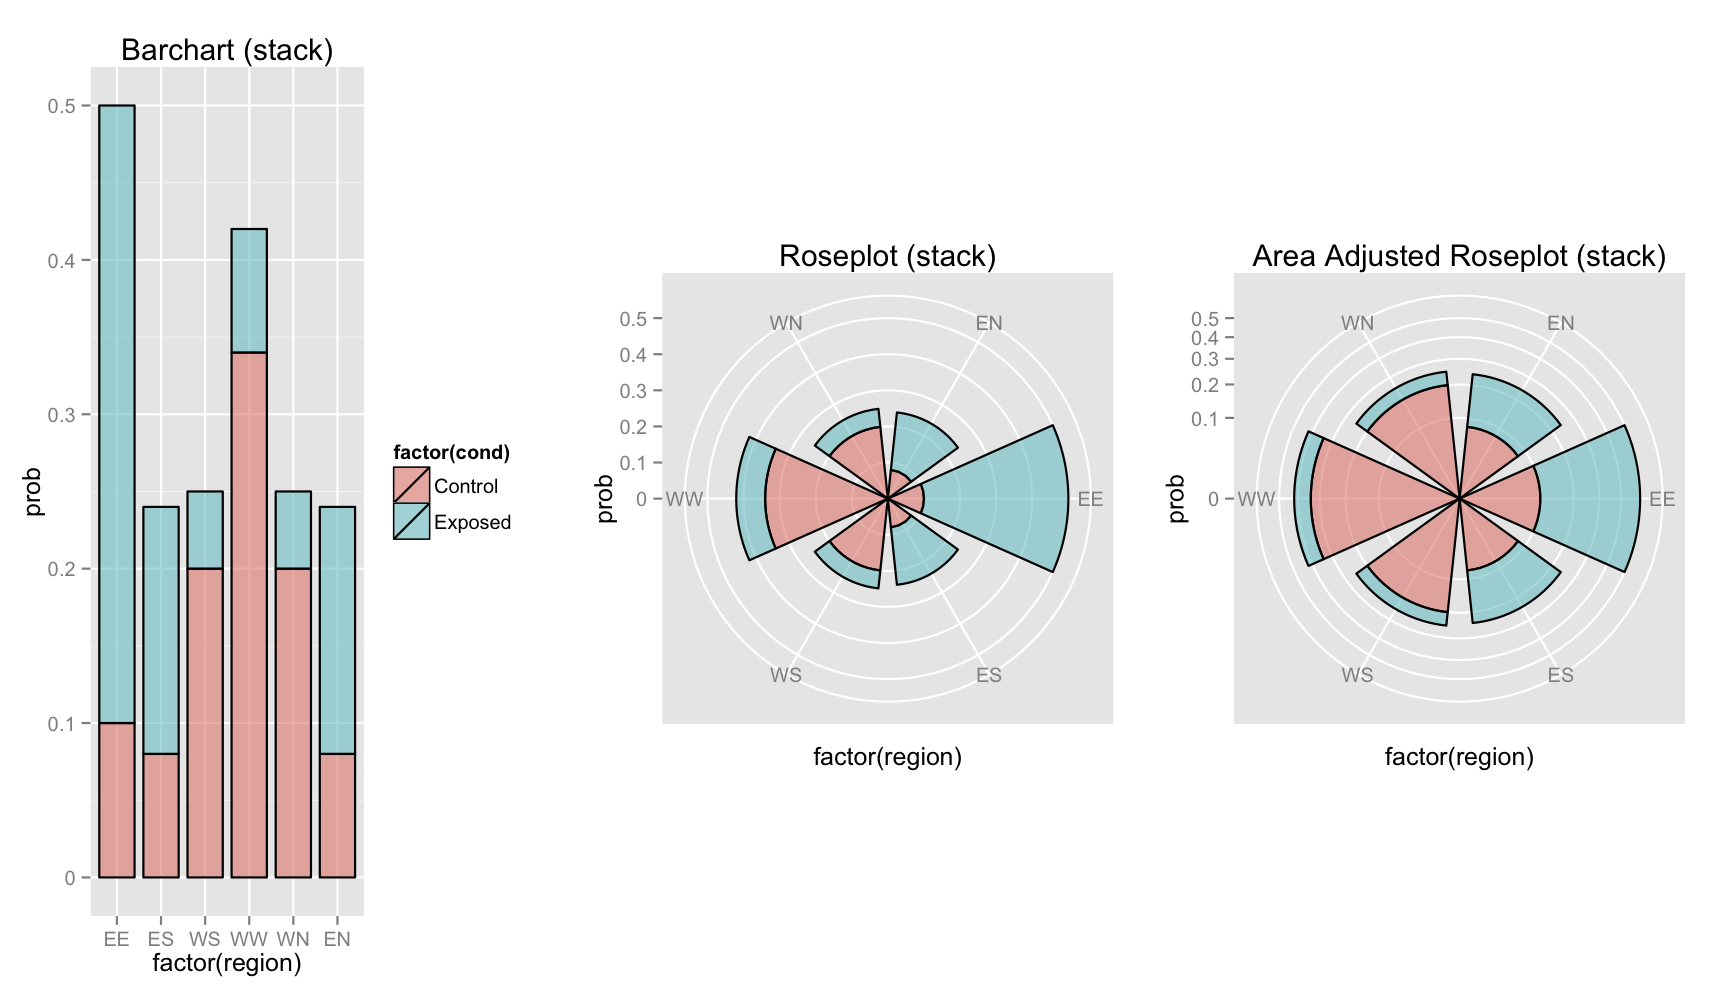
## Stacked barchart, roseplot, area adjusted roseplot
bk <- barchart(prob.cond.region, "stack", rad.max=0.5) + ggtitle("Barchart (stack)")
rk <- roseplot(prob.cond.region, "stack", rad.max=0.5) + ggtitle("Roseplot (stack)") + scale_fill_discrete(guide="none")
ak <- aaroseplot(prob.cond.region, "stack", rad.max=0.5) + ggtitle("Area Adjusted Roseplot (stack)") + scale_fill_discrete(guide="none")
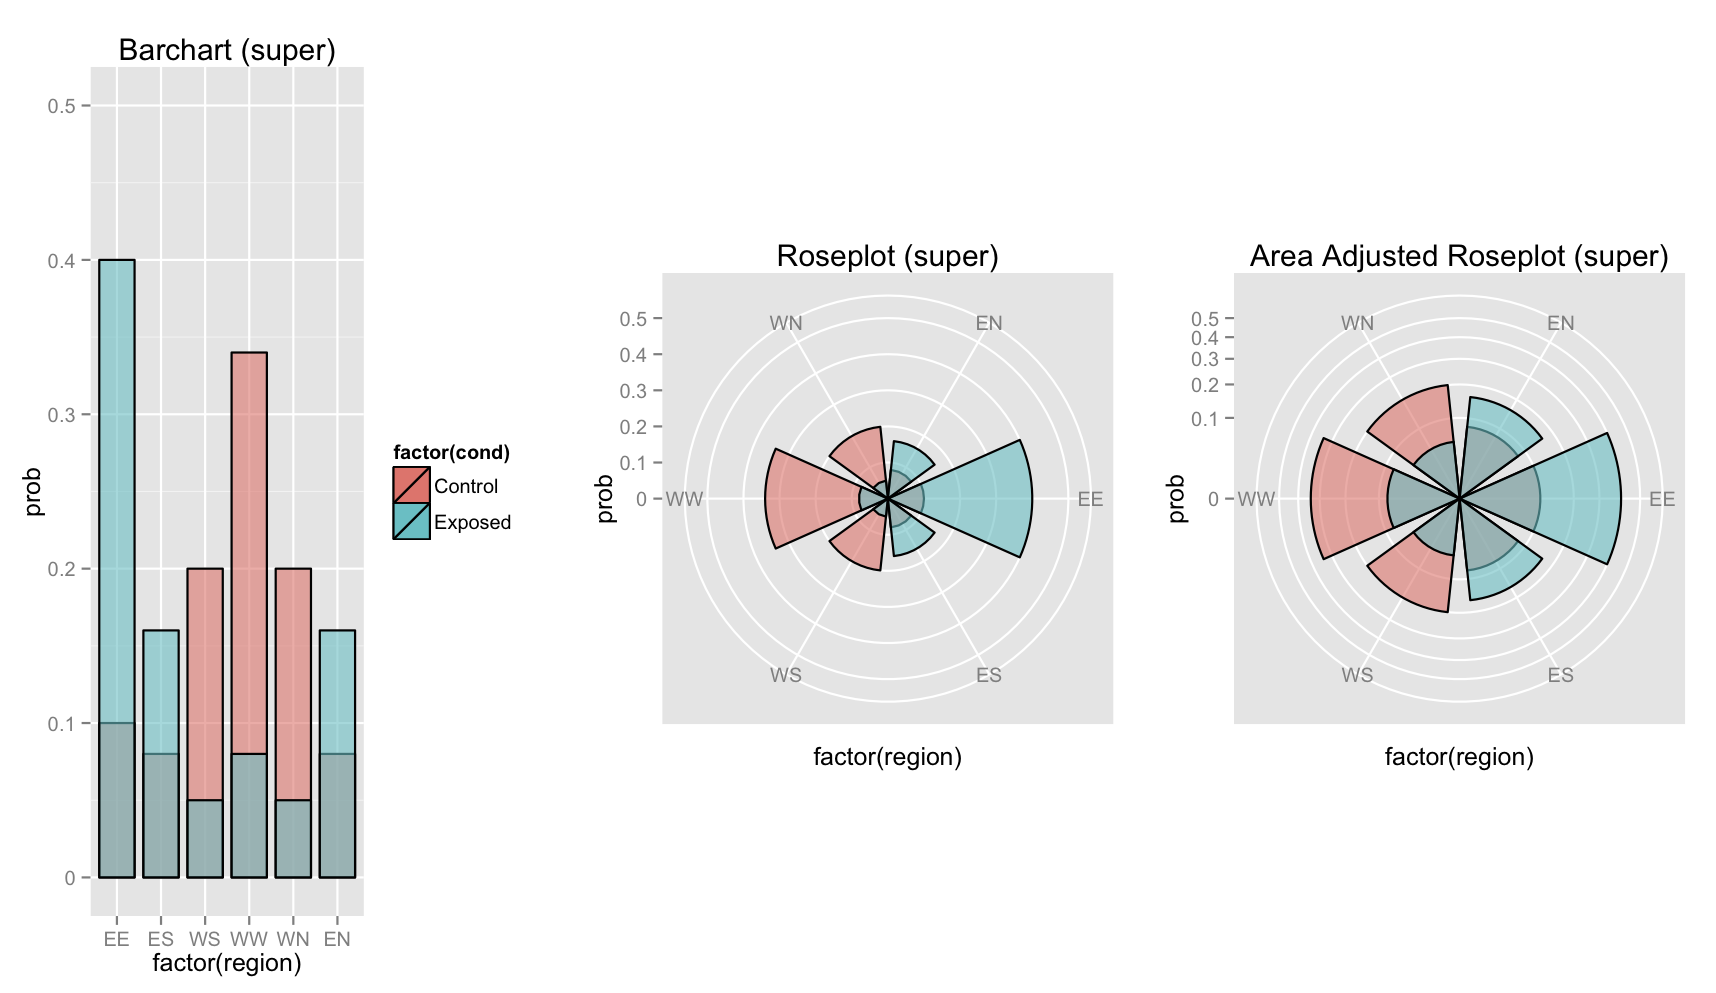
## Superimposed barchart, roseplot, area adjusted roseplot
br <- barchart(prob.cond.region, "super", rad.max=0.5) + ggtitle("Barchart (super)")
rr <- roseplot(prob.cond.region, "super", rad.max=0.5) + ggtitle("Roseplot (super)") + scale_fill_discrete(guide="none")
ar <- aaroseplot(prob.cond.region, "super", rad.max=0.5) + ggtitle("Area Adjusted Roseplot (super)") + scale_fill_discrete(guide="none")
## Dodged, Stacked, and Superimposed barchart, roseplot, area adjusted roseplot in same plot
## tip: maximize window after render
multiplot(be,bk,br,re,rk,rr,ae,ak,ar, cols=3)
Data Format:
To use these functions, the data frame has to have a very specific format. Three columns must be named "prob", "cond", "region".
prob the probability of the cond occupying the regioncond the condition or group classifierregion a label corresponding to a sector/wedge. Must be
consistent across cond
prob.cond.region
##       prob    cond region
##    1  0.10 Control     EE
##    2  0.08 Control     EN
##    3  0.08 Control     ES
##    4  0.20 Control     WN
##    5  0.20 Control     WS
##    6  0.34 Control     WW
##    7  0.40 Exposed     EE
##    8  0.16 Exposed     EN
##    9  0.16 Exposed     ES
##    10 0.05 Exposed     WN
##    11 0.05 Exposed     WS
##    12 0.08 Exposed     WW
Frequently Asked Questions:
Q:  Why not have the _area_ of the bar become the area of the wedge?

A:  Nice idea - I would first need to get my hands on the width of
the bar to calculate the area - email me if you know how to get
the width.

Q: Isn't making canned wrappers of ggplot2 functions a
bastardization of the whole idea of grammar of graphics?

A:  Geez -- listen, I'm a purist too and a big fan of ggplot2 as
well.  I just wanted to make my first github repo after a very
specific project I had involving adjusting the area of some
roseplots.  If you email me the pros/cons of what I'm doing (if
there are even any pros :-) I'd be happy to post them with credit
to you if you so wish.  We're all here to learn, to share, to
source openly.

Q: Some say graphics should not have a value proportional to
radius OR area and just use height
(http://www.biostat.wisc.edu/~kbroman/presentations/more_on_graphs.pdf).
So is going from radius to area (roseplot to aaroseplot) really a
win?

A: The application involves growth from a central point in a 2-D
plane, which lends nicely to polar coordinates (in that East can
be on the right hand side and opposite of West, etc).  Karl Broman
also suggests not including zero, so if only height and not
including zero were displayed, one possibility would be a
pointrange on a polar coordinate axis (below, along with errorbar
and linerange [which includes zero]).  Is this an improvement in
this context?  Let me know and thanks for writing.
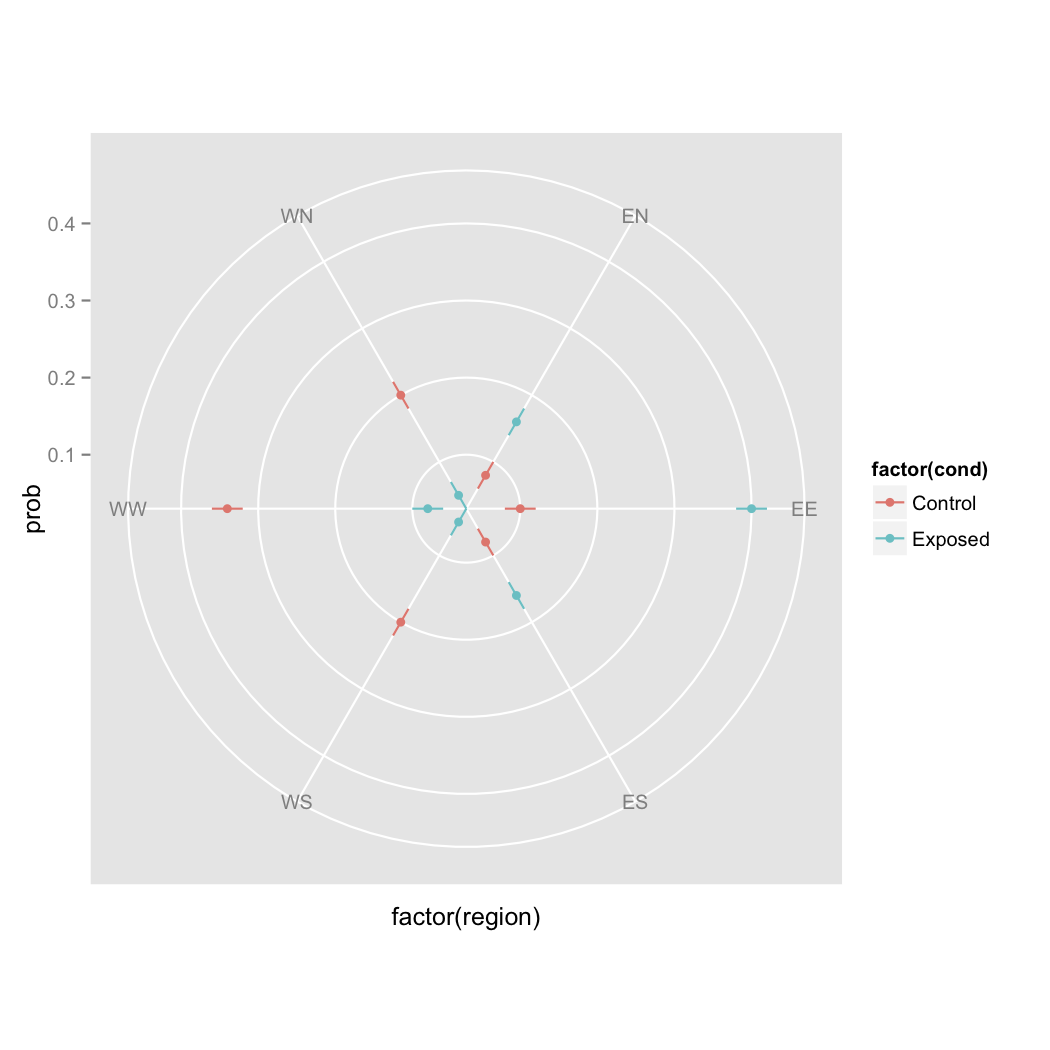
Some alternative representations using height; not area or radius in polar coordinates.
The plots below are not part of the package, but rather some graphs made in response to the FAQ section (above) pointing out that using height is a surefire way to not distort the data. Edit in your own example; there must be a way to graph these nicely; until then I'm inclined to use aaroseplot().
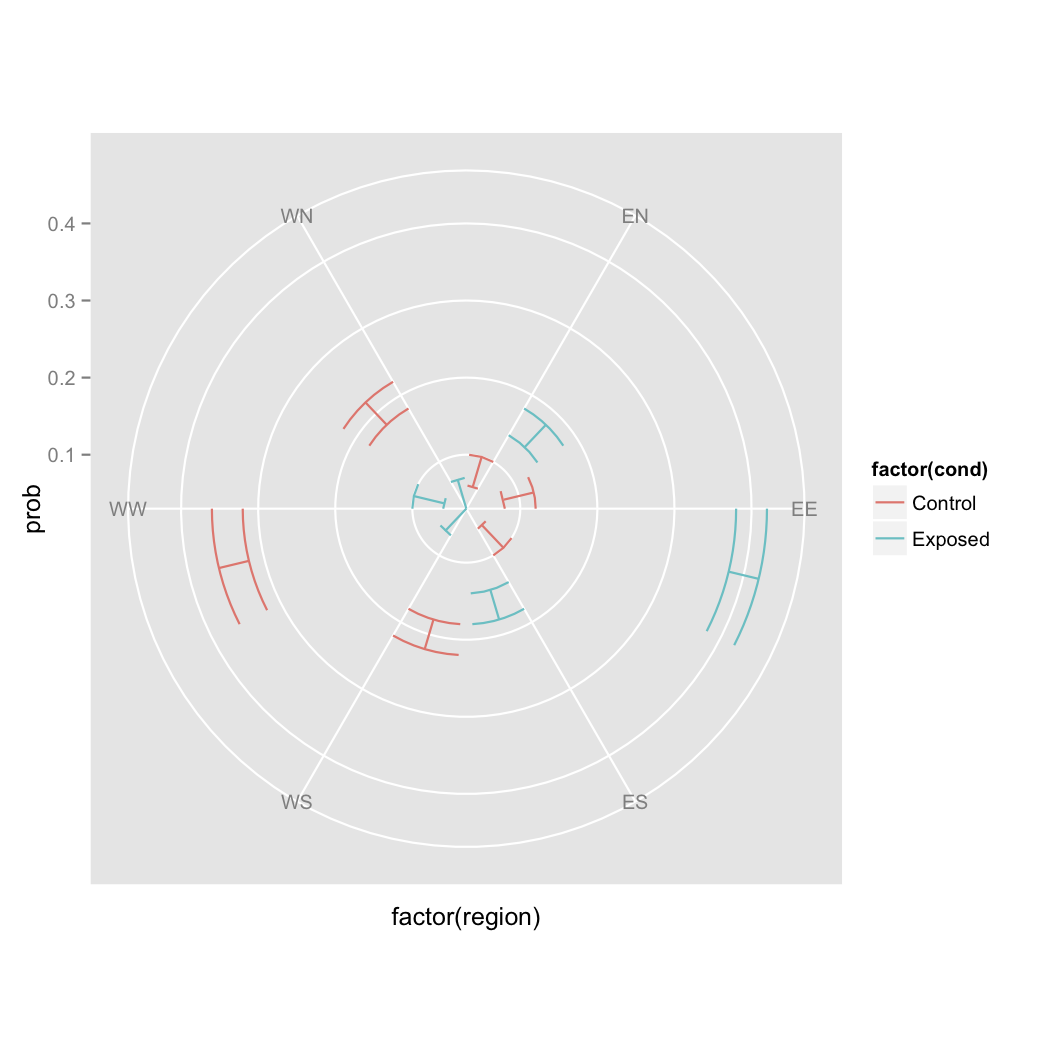
A pointrange presentation (with fake range):
## position="dodge" doesn't seem to work
ggplot(prob.cond.region, aes(x=factor(region), y=prob, colour=factor(cond), ymin=prob-.02, ymax=prob+.02)) +
geom_pointrange(position="dodge")+
coord_polar(start=pi/3)
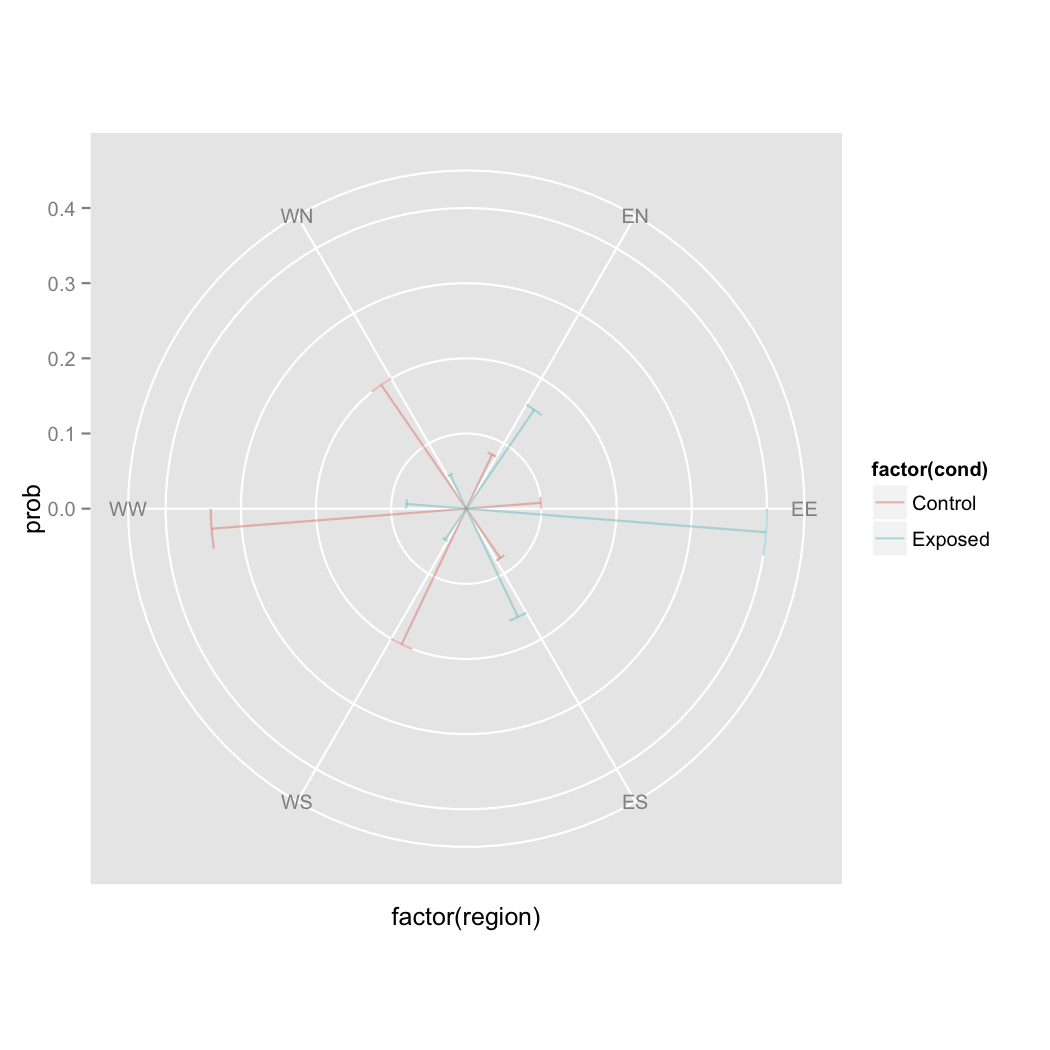
An errorbar presentation (with fake range):
## position="dodge" functions
ggplot(prob.cond.region, aes(x=factor(region), y=prob, colour=factor(cond), ymin=prob-.02, ymax=prob+.02)) +
geom_errorbar(position="dodge")+
coord_polar(start=pi/3)
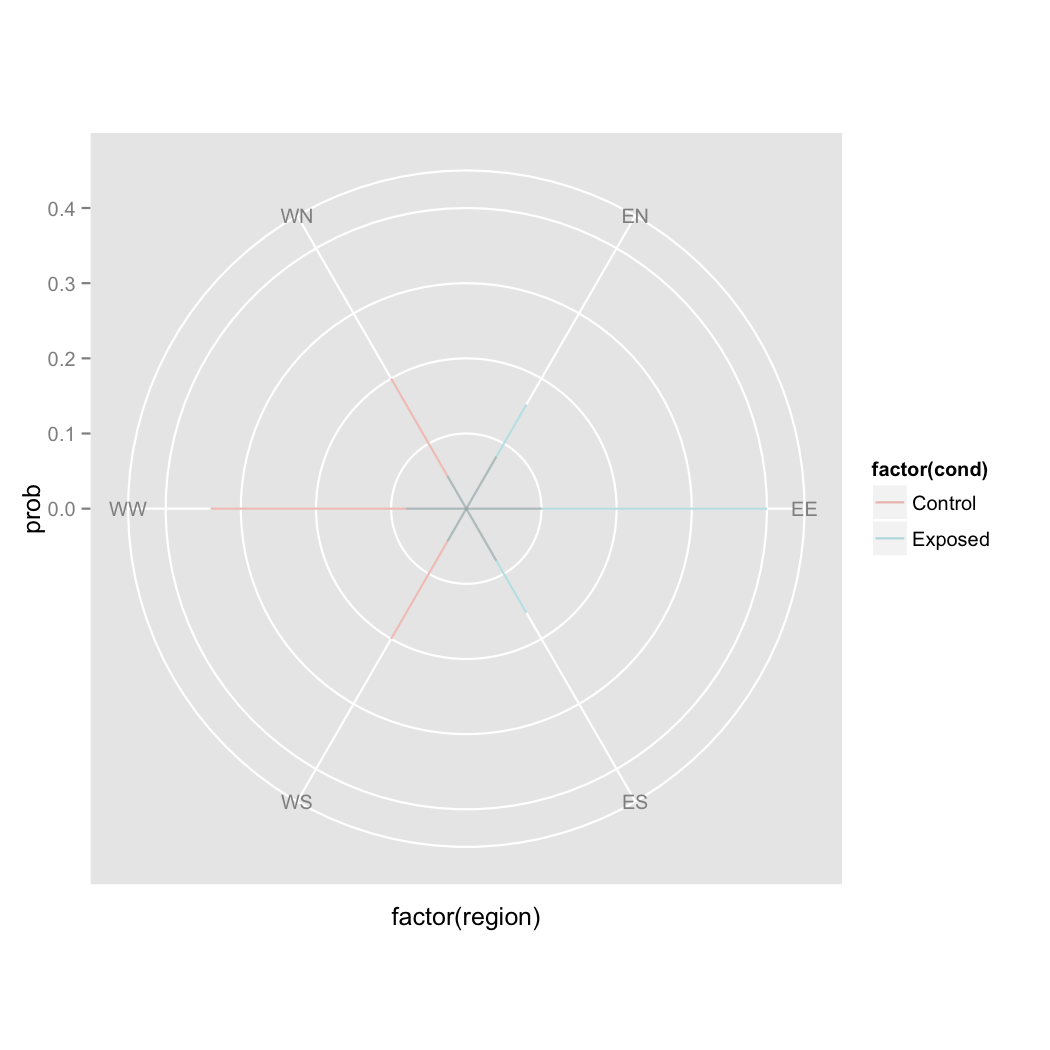
An line presentation (range: 0 to prob):
## need to include 0's
d2 <- prob.cond.region
d2[,1] <- 0
d3 <- rbind(prob.cond.region,d2)
## position="dodge" does not function
ggplot(d3, aes(x=factor(region), y=prob, colour=factor(cond), ymin=0, ymax=prob)) +
geom_line(position="dodge", alpha=.5)+
coord_polar(start=pi/3)
No dodge available so alpha-blending is enabled to lessen the obscuring by overlap.
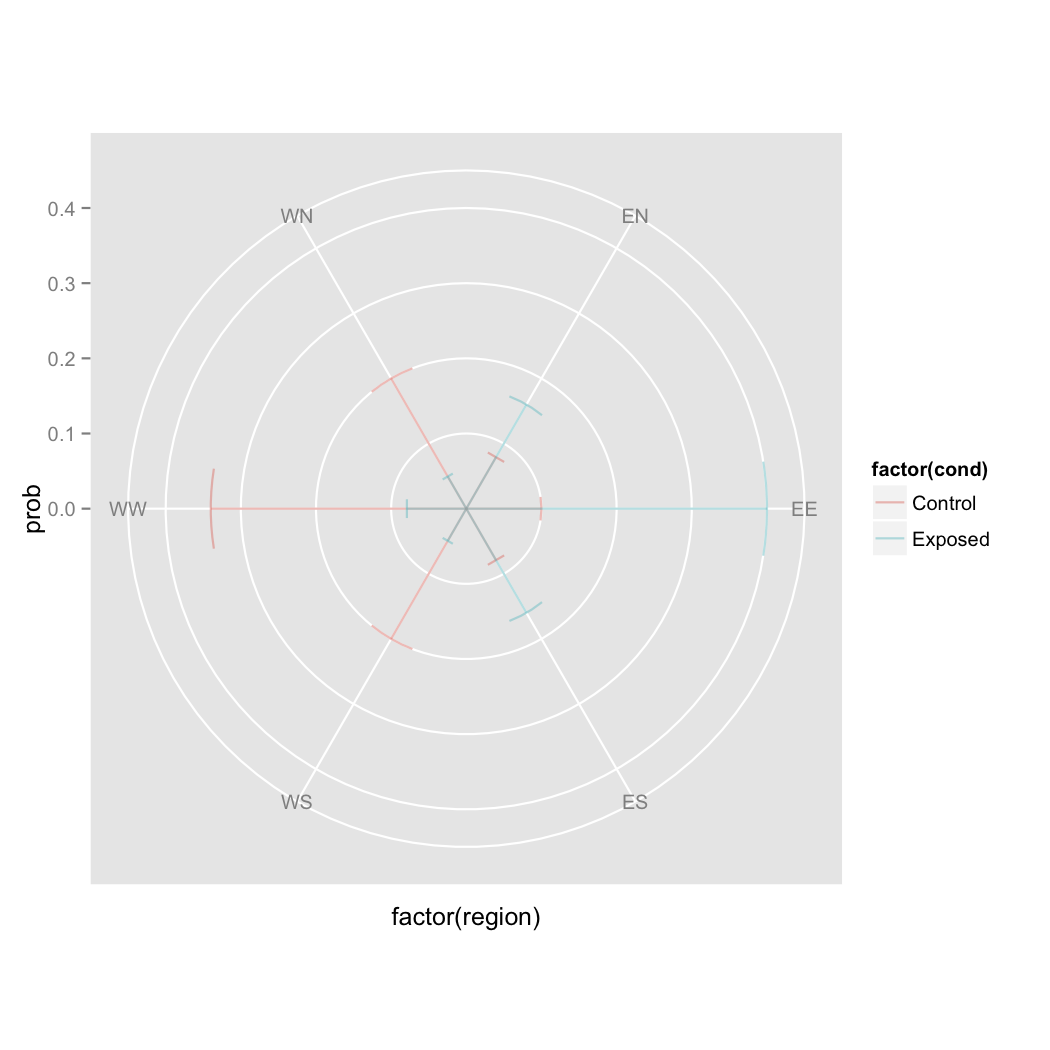
An errorbar presentation (range: 0 to prob):
## position="dodge" does not function
## unless width is nonzero on errobar
## this is why "dodge" doesn't work for line, linerange, pointrange
ggplot(prob.cond.region, aes(x=factor(region), y=prob, colour=factor(cond), ymin=0, ymax=prob)) +
geom_errorbar(position="dodge", alpha=.5, width=.3)+
coord_polar(start=pi/3)
An errorbar presentation (range: 0 to prob, no dodge):
## position="dodge" does not function
## unless width is nonzero on errobar
## this is why "dodge" doesn't work for line, linerange, pointrange
ggplot(prob.cond.region, aes(x=factor(region), y=prob, colour=factor(cond), ymin=0, ymax=prob)) +
geom_errorbar(alpha=.5, width=.3)+
coord_polar(start=pi/3)
The fact that the error bar width is dependent on radius doesn't seem attractive visually.
swihart/aaroseplot documentation built on Nov. 20, 2022, 11:30 a.m.
R Package Documentation
Browse R Packages
We want your feedback!
Note that we can't provide technical support on individual packages. You should contact the package authors for that.
aaroseplot
The prefix "aa" stands for "area adjusted".
aaroseplot is an R package/repo providing an attempt to assuage the "major preceptual problems" of roseplots listed in the note of ggplot2:coord_polar:
NOTE: Use these plots with caution - polar coordinates has
major perceptual problems. The main point of these examples is
to demonstrate how these common plots can be described in the
grammar. Use with EXTREME caution.
When a barchart is converted to a roseplot, the height of the bar becomes the radius of the "wedge". This is problematic perceptually because the relation between the shaded areas of barchart does not persist to a roseplot. For example, if two bars have equal width but one's height is 4x as tall, then the fill-area is 4x as much as well. However, if a wedge has 4x the radius, its fill-area is 16x as much as the referent wedge area. The trick is to have the height of the bar in the bar chart become the area (not the radius) of the roseplot -- thus the area of a traditional roseplot is adjusted: hence the name area adjusted roseplot.
Can I just see what you're talking about?
Run in R:
#install.packages("devtools")
library(devtools)
install_github("hadley/ggplot2")
install_github("swihart/aaroseplot")
library(aaroseplot)
data(prob.cond.region)
## Dodged barchart, roseplot, area adjusted roseplot
be <- barchart(prob.cond.region, "dodge", rad.max=0.5) + ggtitle("Barchart (dodge)")
re <- roseplot(prob.cond.region, "dodge", rad.max=0.5) + ggtitle("Roseplot (dodge)") + scale_fill_discrete(guide="none")
ae <- aaroseplot(prob.cond.region, "dodge", rad.max=0.5) + ggtitle("Area Adjusted Roseplot (dodge)") + scale_fill_discrete(guide="none")
## Stacked barchart, roseplot, area adjusted roseplot
bk <- barchart(prob.cond.region, "stack", rad.max=0.5) + ggtitle("Barchart (stack)")
rk <- roseplot(prob.cond.region, "stack", rad.max=0.5) + ggtitle("Roseplot (stack)") + scale_fill_discrete(guide="none")
ak <- aaroseplot(prob.cond.region, "stack", rad.max=0.5) + ggtitle("Area Adjusted Roseplot (stack)") + scale_fill_discrete(guide="none")
## Superimposed barchart, roseplot, area adjusted roseplot
br <- barchart(prob.cond.region, "super", rad.max=0.5) + ggtitle("Barchart (super)")
rr <- roseplot(prob.cond.region, "super", rad.max=0.5) + ggtitle("Roseplot (super)") + scale_fill_discrete(guide="none")
ar <- aaroseplot(prob.cond.region, "super", rad.max=0.5) + ggtitle("Area Adjusted Roseplot (super)") + scale_fill_discrete(guide="none")
## Dodged, Stacked, and Superimposed barchart, roseplot, area adjusted roseplot in same plot
## tip: maximize window after render
multiplot(be,bk,br,re,rk,rr,ae,ak,ar, cols=3)
Data Format:
To use these functions, the data frame has to have a very specific format. Three columns must be named "prob", "cond", "region".
probthe probability of thecondoccupying theregioncondthe condition or group classifierregiona label corresponding to a sector/wedge. Must be consistent acrosscond
prob.cond.region
## prob cond region
## 1 0.10 Control EE
## 2 0.08 Control EN
## 3 0.08 Control ES
## 4 0.20 Control WN
## 5 0.20 Control WS
## 6 0.34 Control WW
## 7 0.40 Exposed EE
## 8 0.16 Exposed EN
## 9 0.16 Exposed ES
## 10 0.05 Exposed WN
## 11 0.05 Exposed WS
## 12 0.08 Exposed WW
Frequently Asked Questions:
Q: Why not have the _area_ of the bar become the area of the wedge?
A: Nice idea - I would first need to get my hands on the width of
the bar to calculate the area - email me if you know how to get
the width.
Q: Isn't making canned wrappers of ggplot2 functions a
bastardization of the whole idea of grammar of graphics?
A: Geez -- listen, I'm a purist too and a big fan of ggplot2 as
well. I just wanted to make my first github repo after a very
specific project I had involving adjusting the area of some
roseplots. If you email me the pros/cons of what I'm doing (if
there are even any pros :-) I'd be happy to post them with credit
to you if you so wish. We're all here to learn, to share, to
source openly.
Q: Some say graphics should not have a value proportional to
radius OR area and just use height
(http://www.biostat.wisc.edu/~kbroman/presentations/more_on_graphs.pdf).
So is going from radius to area (roseplot to aaroseplot) really a
win?
A: The application involves growth from a central point in a 2-D
plane, which lends nicely to polar coordinates (in that East can
be on the right hand side and opposite of West, etc). Karl Broman
also suggests not including zero, so if only height and not
including zero were displayed, one possibility would be a
pointrange on a polar coordinate axis (below, along with errorbar
and linerange [which includes zero]). Is this an improvement in
this context? Let me know and thanks for writing.
Some alternative representations using height; not area or radius in polar coordinates.
The plots below are not part of the package, but rather some graphs made in response to the FAQ section (above) pointing out that using height is a surefire way to not distort the data. Edit in your own example; there must be a way to graph these nicely; until then I'm inclined to use aaroseplot().
A pointrange presentation (with fake range):
## position="dodge" doesn't seem to work
ggplot(prob.cond.region, aes(x=factor(region), y=prob, colour=factor(cond), ymin=prob-.02, ymax=prob+.02)) +
geom_pointrange(position="dodge")+
coord_polar(start=pi/3)
An errorbar presentation (with fake range):
## position="dodge" functions
ggplot(prob.cond.region, aes(x=factor(region), y=prob, colour=factor(cond), ymin=prob-.02, ymax=prob+.02)) +
geom_errorbar(position="dodge")+
coord_polar(start=pi/3)
An line presentation (range: 0 to prob):
## need to include 0's
d2 <- prob.cond.region
d2[,1] <- 0
d3 <- rbind(prob.cond.region,d2)
## position="dodge" does not function
ggplot(d3, aes(x=factor(region), y=prob, colour=factor(cond), ymin=0, ymax=prob)) +
geom_line(position="dodge", alpha=.5)+
coord_polar(start=pi/3)
No dodge available so alpha-blending is enabled to lessen the obscuring by overlap.
An errorbar presentation (range: 0 to prob):
## position="dodge" does not function
## unless width is nonzero on errobar
## this is why "dodge" doesn't work for line, linerange, pointrange
ggplot(prob.cond.region, aes(x=factor(region), y=prob, colour=factor(cond), ymin=0, ymax=prob)) +
geom_errorbar(position="dodge", alpha=.5, width=.3)+
coord_polar(start=pi/3)
An errorbar presentation (range: 0 to prob, no dodge):
## position="dodge" does not function
## unless width is nonzero on errobar
## this is why "dodge" doesn't work for line, linerange, pointrange
ggplot(prob.cond.region, aes(x=factor(region), y=prob, colour=factor(cond), ymin=0, ymax=prob)) +
geom_errorbar(alpha=.5, width=.3)+
coord_polar(start=pi/3)
The fact that the error bar width is dependent on radius doesn't seem attractive visually.
R Package Documentation
Browse R Packages
We want your feedback!
Note that we can't provide technical support on individual packages. You should contact the package authors for that.
Embedding an R snippet on your website
Add the following code to your website.
For more information on customizing the embed code, read Embedding Snippets.