Nothing
Advanced Queries with purrr"
In CDECRetrieve: Retrieve Data from the California Data Exchange Center
knitr::opts_chunk$set(
  collapse = TRUE,
  eval = FALSE,
  comment = "#>"
)
This article outlines more advanced cases of the cdec_query() function.
Query Multiple Stations
cdec_query() takes just one instance of its arguments, so a user is not allowed
to call
cdec_query(station = c("ccr", "kwk"), dur_code = "h", sensor_num = "25")
but we can implement this same query using higher level functions.
Using purrr
library(purrr)
library(CDECRetrieve)

stations_of_interest <- c("kwk", "ccr", "bsf")

# 'map' through the stations of interest and apply them to the function
map(stations_of_interest, function(s) {
  cdec_query(station = s, sensor_num = "25", dur_code = "h")
})
#> [[1]]
#> # A tibble: 73 x 5
#>    agency_cd location_id datetime            parameter_cd parameter_value
#>    <chr>     <chr>       <dttm>              <chr>                  <dbl>
#>  1 CDEC      KWK         2020-12-07 23:00:00 25                      52.9
#>  2 CDEC      KWK         2020-12-08 00:00:00 25                      52.9
#>  3 CDEC      KWK         2020-12-08 01:00:00 25                      52.9
#>  4 CDEC      KWK         2020-12-08 02:00:00 25                      52.8
#>  5 CDEC      KWK         2020-12-08 03:00:00 25                      52.8
#>  6 CDEC      KWK         2020-12-08 04:00:00 25                      52.8
#>  7 CDEC      KWK         2020-12-08 05:00:00 25                      52.8
#>  8 CDEC      KWK         2020-12-08 06:00:00 25                      52.8
#>  9 CDEC      KWK         2020-12-08 07:00:00 25                      52.8
#> 10 CDEC      KWK         2020-12-08 08:00:00 25                      52.8
#> # ... with 63 more rows
#>
#> [[2]]
#> # A tibble: 73 x 5
#>    agency_cd location_id datetime            parameter_cd parameter_value
#>    <chr>     <chr>       <dttm>              <chr>                  <dbl>
#>  1 CDEC      CCR         2020-12-07 23:00:00 25                      52.4
#>  2 CDEC      CCR         2020-12-08 00:00:00 25                      52.2
#>  3 CDEC      CCR         2020-12-08 01:00:00 25                      52.1
#>  4 CDEC      CCR         2020-12-08 02:00:00 25                      52
#>  5 CDEC      CCR         2020-12-08 03:00:00 25                      51.9
#>  6 CDEC      CCR         2020-12-08 04:00:00 25                      51.9
#>  7 CDEC      CCR         2020-12-08 05:00:00 25                      51.8
#>  8 CDEC      CCR         2020-12-08 06:00:00 25                      51.7
#>  9 CDEC      CCR         2020-12-08 07:00:00 25                      51.6
#> 10 CDEC      CCR         2020-12-08 08:00:00 25                      51.6
#> # ... with 63 more rows
#>
#> [[3]]
#> # A tibble: 73 x 5
#>    agency_cd location_id datetime            parameter_cd parameter_value
#>    <chr>     <chr>       <dttm>              <chr>                  <dbl>
#>  1 CDEC      BSF         2020-12-07 23:00:00 25                      52.4
#>  2 CDEC      BSF         2020-12-08 00:00:00 25                      52.2
#>  3 CDEC      BSF         2020-12-08 01:00:00 25                      52
#>  4 CDEC      BSF         2020-12-08 02:00:00 25                      51.9
#>  5 CDEC      BSF         2020-12-08 03:00:00 25                      51.7
#>  6 CDEC      BSF         2020-12-08 04:00:00 25                      51.5
#>  7 CDEC      BSF         2020-12-08 05:00:00 25                      51.2
#>  8 CDEC      BSF         2020-12-08 06:00:00 25                      50.9
#>  9 CDEC      BSF         2020-12-08 07:00:00 25                      50.7
#> 10 CDEC      BSF         2020-12-08 08:00:00 25                      50.5
#> # ... with 63 more rows
Using map will return the call to cdec_query, returning each as an element of a list.
This is ok, but we know that the query will return a data.frame with the same structure
for each so we can combine these to get one dataframe.
This can be done by using a variant of the map function, map_df()
temp_data <- map_df(stations_of_interest, function(s) {
  cdec_query(station = s, sensor_num = "25", dur_code = "h")
})

head(temp_data)
#> # A tibble: 6 x 5
#>   agency_cd location_id datetime            parameter_cd parameter_value
#>   <chr>     <chr>       <dttm>              <chr>                  <dbl>
#> 1 CDEC      KWK         2020-12-07 23:00:00 25                      52.9
#> 2 CDEC      KWK         2020-12-08 00:00:00 25                      52.9
#> 3 CDEC      KWK         2020-12-08 01:00:00 25                      52.9
#> 4 CDEC      KWK         2020-12-08 02:00:00 25                      52.8
#> 5 CDEC      KWK         2020-12-08 03:00:00 25                      52.8
#> 6 CDEC      KWK         2020-12-08 04:00:00 25                      52.8
and now we can visualize these,
library(ggplot2)

temp_data %>%
  ggplot(aes(datetime, parameter_value, color=location_id)) + geom_line()
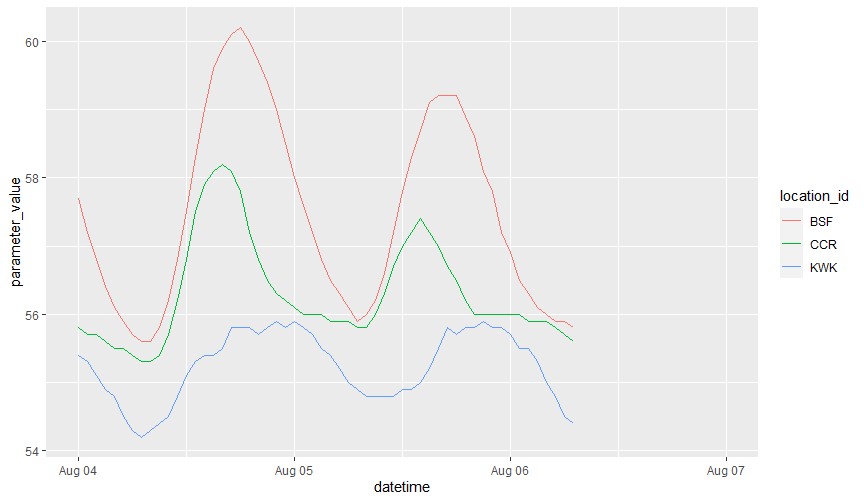
Great!
We can still improve this by using some shortcut features in purrr. Namely we can
shorten the function part of map_df using the ~ shortcut.
# here ~ tells map that this a function, and to interpret '.' as a value
# being passed from the `stations_of_interest`
map_df(stations_of_interest, ~cdec_query(., "25", "h"))
#> # A tibble: 219 x 5
#>    agency_cd location_id datetime            parameter_cd parameter_value
#>    <chr>     <chr>       <dttm>              <chr>                  <dbl>
#>  1 CDEC      KWK         2020-12-07 23:00:00 25                      52.9
#>  2 CDEC      KWK         2020-12-08 00:00:00 25                      52.9
#>  3 CDEC      KWK         2020-12-08 01:00:00 25                      52.9
#>  4 CDEC      KWK         2020-12-08 02:00:00 25                      52.8
#>  5 CDEC      KWK         2020-12-08 03:00:00 25                      52.8
#>  6 CDEC      KWK         2020-12-08 04:00:00 25                      52.8
#>  7 CDEC      KWK         2020-12-08 05:00:00 25                      52.8
#>  8 CDEC      KWK         2020-12-08 06:00:00 25                      52.8
#>  9 CDEC      KWK         2020-12-08 07:00:00 25                      52.8
#> 10 CDEC      KWK         2020-12-08 08:00:00 25                      52.8
#> # ... with 209 more rows
Combination of multiple Arguments
The above section gave us the basic recipe for playing with multiple stations (and
multiple of any other arguments), in this section we expand this to tackle multiple
combinations of each. There are many ways to accomplish this, but I outline a recipe
that has worked well for me.
First lets gather all the pieces we want to have changing,
stations_of_interest <- c("ccr", "kwk")
sensors_of_interest <- c("25", "1")
dur_code = "h"
Now we can use yet another variant of map, pmap_df to pass in an
arbitrary number of arguments,
pmap_df(list(stations_of_interest,
             sensors_of_interest,
             dur_code), ~cdec_query(station = ..1, sensor_num = ..2, dur_code = ..3))
#> # A tibble: 146 x 5
#>    agency_cd location_id datetime            parameter_cd parameter_value
#>    <chr>     <chr>       <dttm>              <chr>                  <dbl>
#>  1 CDEC      CCR         2020-12-07 23:00:00 25                      52.4
#>  2 CDEC      CCR         2020-12-08 00:00:00 25                      52.2
#>  3 CDEC      CCR         2020-12-08 01:00:00 25                      52.1
#>  4 CDEC      CCR         2020-12-08 02:00:00 25                      52
#>  5 CDEC      CCR         2020-12-08 03:00:00 25                      51.9
#>  6 CDEC      CCR         2020-12-08 04:00:00 25                      51.9
#>  7 CDEC      CCR         2020-12-08 05:00:00 25                      51.8
#>  8 CDEC      CCR         2020-12-08 06:00:00 25                      51.7
#>  9 CDEC      CCR         2020-12-08 07:00:00 25                      51.6
#> 10 CDEC      CCR         2020-12-08 08:00:00 25                      51.6
#> # ... with 136 more rows
Here we use ..1, ..2, ..3 to refer to the first, second and third elements of the list,
we can grow this any number of arguments.
Making a custom function
In the above we don't really change dur_code but we still need to supply it into
the function. We can save some time by creating a function out of cdec_query(), using
purrr::partial(), we can create a function that takes two arguments and has "dur_code"
fixed to "h". This allow us to use map2_df instead of pmap_df.
cdec_query_hourly <- purrr::partial(cdec_query, dur_code="h")

# we only have to supply two arguments
map2_df(stations_of_interest, sensors_of_interest,
        ~cdec_query_hourly(station=.x, sensor_num=.y))
#> # A tibble: 146 x 5
#>    agency_cd location_id datetime            parameter_cd parameter_value
#>    <chr>     <chr>       <dttm>              <chr>                  <dbl>
#>  1 CDEC      CCR         2020-12-07 23:00:00 25                      52.4
#>  2 CDEC      CCR         2020-12-08 00:00:00 25                      52.2
#>  3 CDEC      CCR         2020-12-08 01:00:00 25                      52.1
#>  4 CDEC      CCR         2020-12-08 02:00:00 25                      52
#>  5 CDEC      CCR         2020-12-08 03:00:00 25                      51.9
#>  6 CDEC      CCR         2020-12-08 04:00:00 25                      51.9
#>  7 CDEC      CCR         2020-12-08 05:00:00 25                      51.8
#>  8 CDEC      CCR         2020-12-08 06:00:00 25                      51.7
#>  9 CDEC      CCR         2020-12-08 07:00:00 25                      51.6
#> 10 CDEC      CCR         2020-12-08 08:00:00 25                      51.6
#> # ... with 136 more rows
All combinations of arguments
Here is a way to query for a set of all combination of inputs for a given set of
stations and sensors.
Note: you need confirm these combinations make sense to query.
stations_of_interest <- c("bsf", "kwk")
sensors_of_interest <- c("25", "27")
dur_code <- "h"

# data frame of all combinations
ins <- expand.grid(x=stations_of_interest,
                   y=sensors_of_interest,
                   z=dur_code,
                   stringsAsFactors = FALSE)

temp_and_turb <-
  pmap_df(list(ins$x, ins$y, ins$z), ~cdec_query(..1, ..2, ..3))

head(temp_and_turb)
#> # A tibble: 6 x 5
#>   agency_cd location_id datetime            parameter_cd parameter_value
#>   <chr>     <chr>       <dttm>              <chr>                  <dbl>
#> 1 CDEC      BSF         2020-12-07 23:00:00 25                      52.4
#> 2 CDEC      BSF         2020-12-08 00:00:00 25                      52.2
#> 3 CDEC      BSF         2020-12-08 01:00:00 25                      52
#> 4 CDEC      BSF         2020-12-08 02:00:00 25                      51.9
#> 5 CDEC      BSF         2020-12-08 03:00:00 25                      51.7
#> 6 CDEC      BSF         2020-12-08 04:00:00 25                      51.5
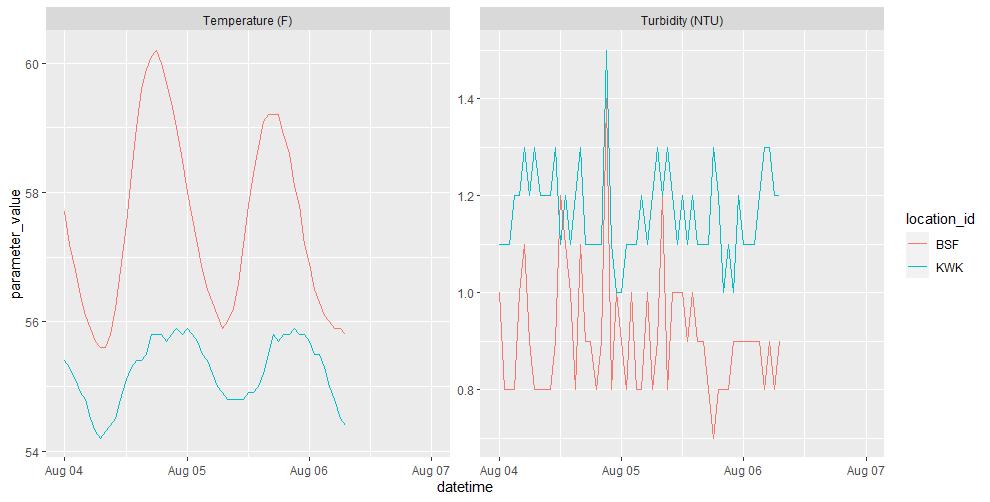
and now we can visualize these
param_names <- c("25" = "Temperature (F)", "27" = "Turbidity (NTU)")
temp_and_turb %>%
  ggplot(aes(datetime, parameter_value, color=location_id)) +
  geom_line() +
  facet_wrap(. ~ param_names[parameter_cd], scales = "free")
Try the CDECRetrieve package in your browser
Any scripts or data that you put into this service are public.
CDECRetrieve documentation built on Sept. 24, 2021, 9:07 a.m.
R Package Documentation
Browse R Packages
We want your feedback!
Note that we can't provide technical support on individual packages. You should contact the package authors for that.
knitr::opts_chunk$set( collapse = TRUE, eval = FALSE, comment = "#>" )
This article outlines more advanced cases of the cdec_query() function.
Query Multiple Stations
cdec_query() takes just one instance of its arguments, so a user is not allowed
to call
cdec_query(station = c("ccr", "kwk"), dur_code = "h", sensor_num = "25")
but we can implement this same query using higher level functions.
Using purrr
library(purrr) library(CDECRetrieve) stations_of_interest <- c("kwk", "ccr", "bsf") # 'map' through the stations of interest and apply them to the function map(stations_of_interest, function(s) { cdec_query(station = s, sensor_num = "25", dur_code = "h") }) #> [[1]] #> # A tibble: 73 x 5 #> agency_cd location_id datetime parameter_cd parameter_value #> <chr> <chr> <dttm> <chr> <dbl> #> 1 CDEC KWK 2020-12-07 23:00:00 25 52.9 #> 2 CDEC KWK 2020-12-08 00:00:00 25 52.9 #> 3 CDEC KWK 2020-12-08 01:00:00 25 52.9 #> 4 CDEC KWK 2020-12-08 02:00:00 25 52.8 #> 5 CDEC KWK 2020-12-08 03:00:00 25 52.8 #> 6 CDEC KWK 2020-12-08 04:00:00 25 52.8 #> 7 CDEC KWK 2020-12-08 05:00:00 25 52.8 #> 8 CDEC KWK 2020-12-08 06:00:00 25 52.8 #> 9 CDEC KWK 2020-12-08 07:00:00 25 52.8 #> 10 CDEC KWK 2020-12-08 08:00:00 25 52.8 #> # ... with 63 more rows #> #> [[2]] #> # A tibble: 73 x 5 #> agency_cd location_id datetime parameter_cd parameter_value #> <chr> <chr> <dttm> <chr> <dbl> #> 1 CDEC CCR 2020-12-07 23:00:00 25 52.4 #> 2 CDEC CCR 2020-12-08 00:00:00 25 52.2 #> 3 CDEC CCR 2020-12-08 01:00:00 25 52.1 #> 4 CDEC CCR 2020-12-08 02:00:00 25 52 #> 5 CDEC CCR 2020-12-08 03:00:00 25 51.9 #> 6 CDEC CCR 2020-12-08 04:00:00 25 51.9 #> 7 CDEC CCR 2020-12-08 05:00:00 25 51.8 #> 8 CDEC CCR 2020-12-08 06:00:00 25 51.7 #> 9 CDEC CCR 2020-12-08 07:00:00 25 51.6 #> 10 CDEC CCR 2020-12-08 08:00:00 25 51.6 #> # ... with 63 more rows #> #> [[3]] #> # A tibble: 73 x 5 #> agency_cd location_id datetime parameter_cd parameter_value #> <chr> <chr> <dttm> <chr> <dbl> #> 1 CDEC BSF 2020-12-07 23:00:00 25 52.4 #> 2 CDEC BSF 2020-12-08 00:00:00 25 52.2 #> 3 CDEC BSF 2020-12-08 01:00:00 25 52 #> 4 CDEC BSF 2020-12-08 02:00:00 25 51.9 #> 5 CDEC BSF 2020-12-08 03:00:00 25 51.7 #> 6 CDEC BSF 2020-12-08 04:00:00 25 51.5 #> 7 CDEC BSF 2020-12-08 05:00:00 25 51.2 #> 8 CDEC BSF 2020-12-08 06:00:00 25 50.9 #> 9 CDEC BSF 2020-12-08 07:00:00 25 50.7 #> 10 CDEC BSF 2020-12-08 08:00:00 25 50.5 #> # ... with 63 more rows
Using map will return the call to cdec_query, returning each as an element of a list.
This is ok, but we know that the query will return a data.frame with the same structure
for each so we can combine these to get one dataframe.
This can be done by using a variant of the map function, map_df()
temp_data <- map_df(stations_of_interest, function(s) { cdec_query(station = s, sensor_num = "25", dur_code = "h") }) head(temp_data) #> # A tibble: 6 x 5 #> agency_cd location_id datetime parameter_cd parameter_value #> <chr> <chr> <dttm> <chr> <dbl> #> 1 CDEC KWK 2020-12-07 23:00:00 25 52.9 #> 2 CDEC KWK 2020-12-08 00:00:00 25 52.9 #> 3 CDEC KWK 2020-12-08 01:00:00 25 52.9 #> 4 CDEC KWK 2020-12-08 02:00:00 25 52.8 #> 5 CDEC KWK 2020-12-08 03:00:00 25 52.8 #> 6 CDEC KWK 2020-12-08 04:00:00 25 52.8
and now we can visualize these,
library(ggplot2) temp_data %>% ggplot(aes(datetime, parameter_value, color=location_id)) + geom_line()
Great!
We can still improve this by using some shortcut features in purrr. Namely we can
shorten the function part of map_df using the ~ shortcut.
# here ~ tells map that this a function, and to interpret '.' as a value # being passed from the `stations_of_interest` map_df(stations_of_interest, ~cdec_query(., "25", "h")) #> # A tibble: 219 x 5 #> agency_cd location_id datetime parameter_cd parameter_value #> <chr> <chr> <dttm> <chr> <dbl> #> 1 CDEC KWK 2020-12-07 23:00:00 25 52.9 #> 2 CDEC KWK 2020-12-08 00:00:00 25 52.9 #> 3 CDEC KWK 2020-12-08 01:00:00 25 52.9 #> 4 CDEC KWK 2020-12-08 02:00:00 25 52.8 #> 5 CDEC KWK 2020-12-08 03:00:00 25 52.8 #> 6 CDEC KWK 2020-12-08 04:00:00 25 52.8 #> 7 CDEC KWK 2020-12-08 05:00:00 25 52.8 #> 8 CDEC KWK 2020-12-08 06:00:00 25 52.8 #> 9 CDEC KWK 2020-12-08 07:00:00 25 52.8 #> 10 CDEC KWK 2020-12-08 08:00:00 25 52.8 #> # ... with 209 more rows
Combination of multiple Arguments
The above section gave us the basic recipe for playing with multiple stations (and multiple of any other arguments), in this section we expand this to tackle multiple combinations of each. There are many ways to accomplish this, but I outline a recipe that has worked well for me.
First lets gather all the pieces we want to have changing,
stations_of_interest <- c("ccr", "kwk") sensors_of_interest <- c("25", "1") dur_code = "h"
Now we can use yet another variant of map, pmap_df to pass in an
arbitrary number of arguments,
pmap_df(list(stations_of_interest, sensors_of_interest, dur_code), ~cdec_query(station = ..1, sensor_num = ..2, dur_code = ..3)) #> # A tibble: 146 x 5 #> agency_cd location_id datetime parameter_cd parameter_value #> <chr> <chr> <dttm> <chr> <dbl> #> 1 CDEC CCR 2020-12-07 23:00:00 25 52.4 #> 2 CDEC CCR 2020-12-08 00:00:00 25 52.2 #> 3 CDEC CCR 2020-12-08 01:00:00 25 52.1 #> 4 CDEC CCR 2020-12-08 02:00:00 25 52 #> 5 CDEC CCR 2020-12-08 03:00:00 25 51.9 #> 6 CDEC CCR 2020-12-08 04:00:00 25 51.9 #> 7 CDEC CCR 2020-12-08 05:00:00 25 51.8 #> 8 CDEC CCR 2020-12-08 06:00:00 25 51.7 #> 9 CDEC CCR 2020-12-08 07:00:00 25 51.6 #> 10 CDEC CCR 2020-12-08 08:00:00 25 51.6 #> # ... with 136 more rows
Here we use ..1, ..2, ..3 to refer to the first, second and third elements of the list,
we can grow this any number of arguments.
Making a custom function
In the above we don't really change dur_code but we still need to supply it into
the function. We can save some time by creating a function out of cdec_query(), using
purrr::partial(), we can create a function that takes two arguments and has "dur_code"
fixed to "h". This allow us to use map2_df instead of pmap_df.
cdec_query_hourly <- purrr::partial(cdec_query, dur_code="h") # we only have to supply two arguments map2_df(stations_of_interest, sensors_of_interest, ~cdec_query_hourly(station=.x, sensor_num=.y)) #> # A tibble: 146 x 5 #> agency_cd location_id datetime parameter_cd parameter_value #> <chr> <chr> <dttm> <chr> <dbl> #> 1 CDEC CCR 2020-12-07 23:00:00 25 52.4 #> 2 CDEC CCR 2020-12-08 00:00:00 25 52.2 #> 3 CDEC CCR 2020-12-08 01:00:00 25 52.1 #> 4 CDEC CCR 2020-12-08 02:00:00 25 52 #> 5 CDEC CCR 2020-12-08 03:00:00 25 51.9 #> 6 CDEC CCR 2020-12-08 04:00:00 25 51.9 #> 7 CDEC CCR 2020-12-08 05:00:00 25 51.8 #> 8 CDEC CCR 2020-12-08 06:00:00 25 51.7 #> 9 CDEC CCR 2020-12-08 07:00:00 25 51.6 #> 10 CDEC CCR 2020-12-08 08:00:00 25 51.6 #> # ... with 136 more rows
All combinations of arguments
Here is a way to query for a set of all combination of inputs for a given set of stations and sensors.
Note: you need confirm these combinations make sense to query.
stations_of_interest <- c("bsf", "kwk") sensors_of_interest <- c("25", "27") dur_code <- "h" # data frame of all combinations ins <- expand.grid(x=stations_of_interest, y=sensors_of_interest, z=dur_code, stringsAsFactors = FALSE) temp_and_turb <- pmap_df(list(ins$x, ins$y, ins$z), ~cdec_query(..1, ..2, ..3)) head(temp_and_turb) #> # A tibble: 6 x 5 #> agency_cd location_id datetime parameter_cd parameter_value #> <chr> <chr> <dttm> <chr> <dbl> #> 1 CDEC BSF 2020-12-07 23:00:00 25 52.4 #> 2 CDEC BSF 2020-12-08 00:00:00 25 52.2 #> 3 CDEC BSF 2020-12-08 01:00:00 25 52 #> 4 CDEC BSF 2020-12-08 02:00:00 25 51.9 #> 5 CDEC BSF 2020-12-08 03:00:00 25 51.7 #> 6 CDEC BSF 2020-12-08 04:00:00 25 51.5
and now we can visualize these
param_names <- c("25" = "Temperature (F)", "27" = "Turbidity (NTU)") temp_and_turb %>% ggplot(aes(datetime, parameter_value, color=location_id)) + geom_line() + facet_wrap(. ~ param_names[parameter_cd], scales = "free")
Try the CDECRetrieve package in your browser
Any scripts or data that you put into this service are public.
R Package Documentation
Browse R Packages
We want your feedback!
Note that we can't provide technical support on individual packages. You should contact the package authors for that.
Embedding an R snippet on your website
Add the following code to your website.
For more information on customizing the embed code, read Embedding Snippets.