Nothing
README.md
In GWalkR: Interactive Exploratory Data Analysis Tool

GWalkR: Your One-Stop R Package for Exploratory Data Analysis with Visualization


Start Exploratory Data Analysis (EDA) in R with a Single Line of Code!
GWalkR is an interactive Exploratory Data Analysis (EDA) Tool in R.
It integrates the htmlwidgets with Graphic Walker.
It can simplify your R data analysis and data visualization workflow, by turning your data frame into a Tableau-style User Interface for visual exploration.

If you prefer using Python, you can check out PyGWalker!
Getting Started
Setup GWalkR
install.packages("GWalkR")
library(GWalkR)
Start Your Data Exploration in a Single Line of Code
data(iris)
gwalkr(iris)
Main Features
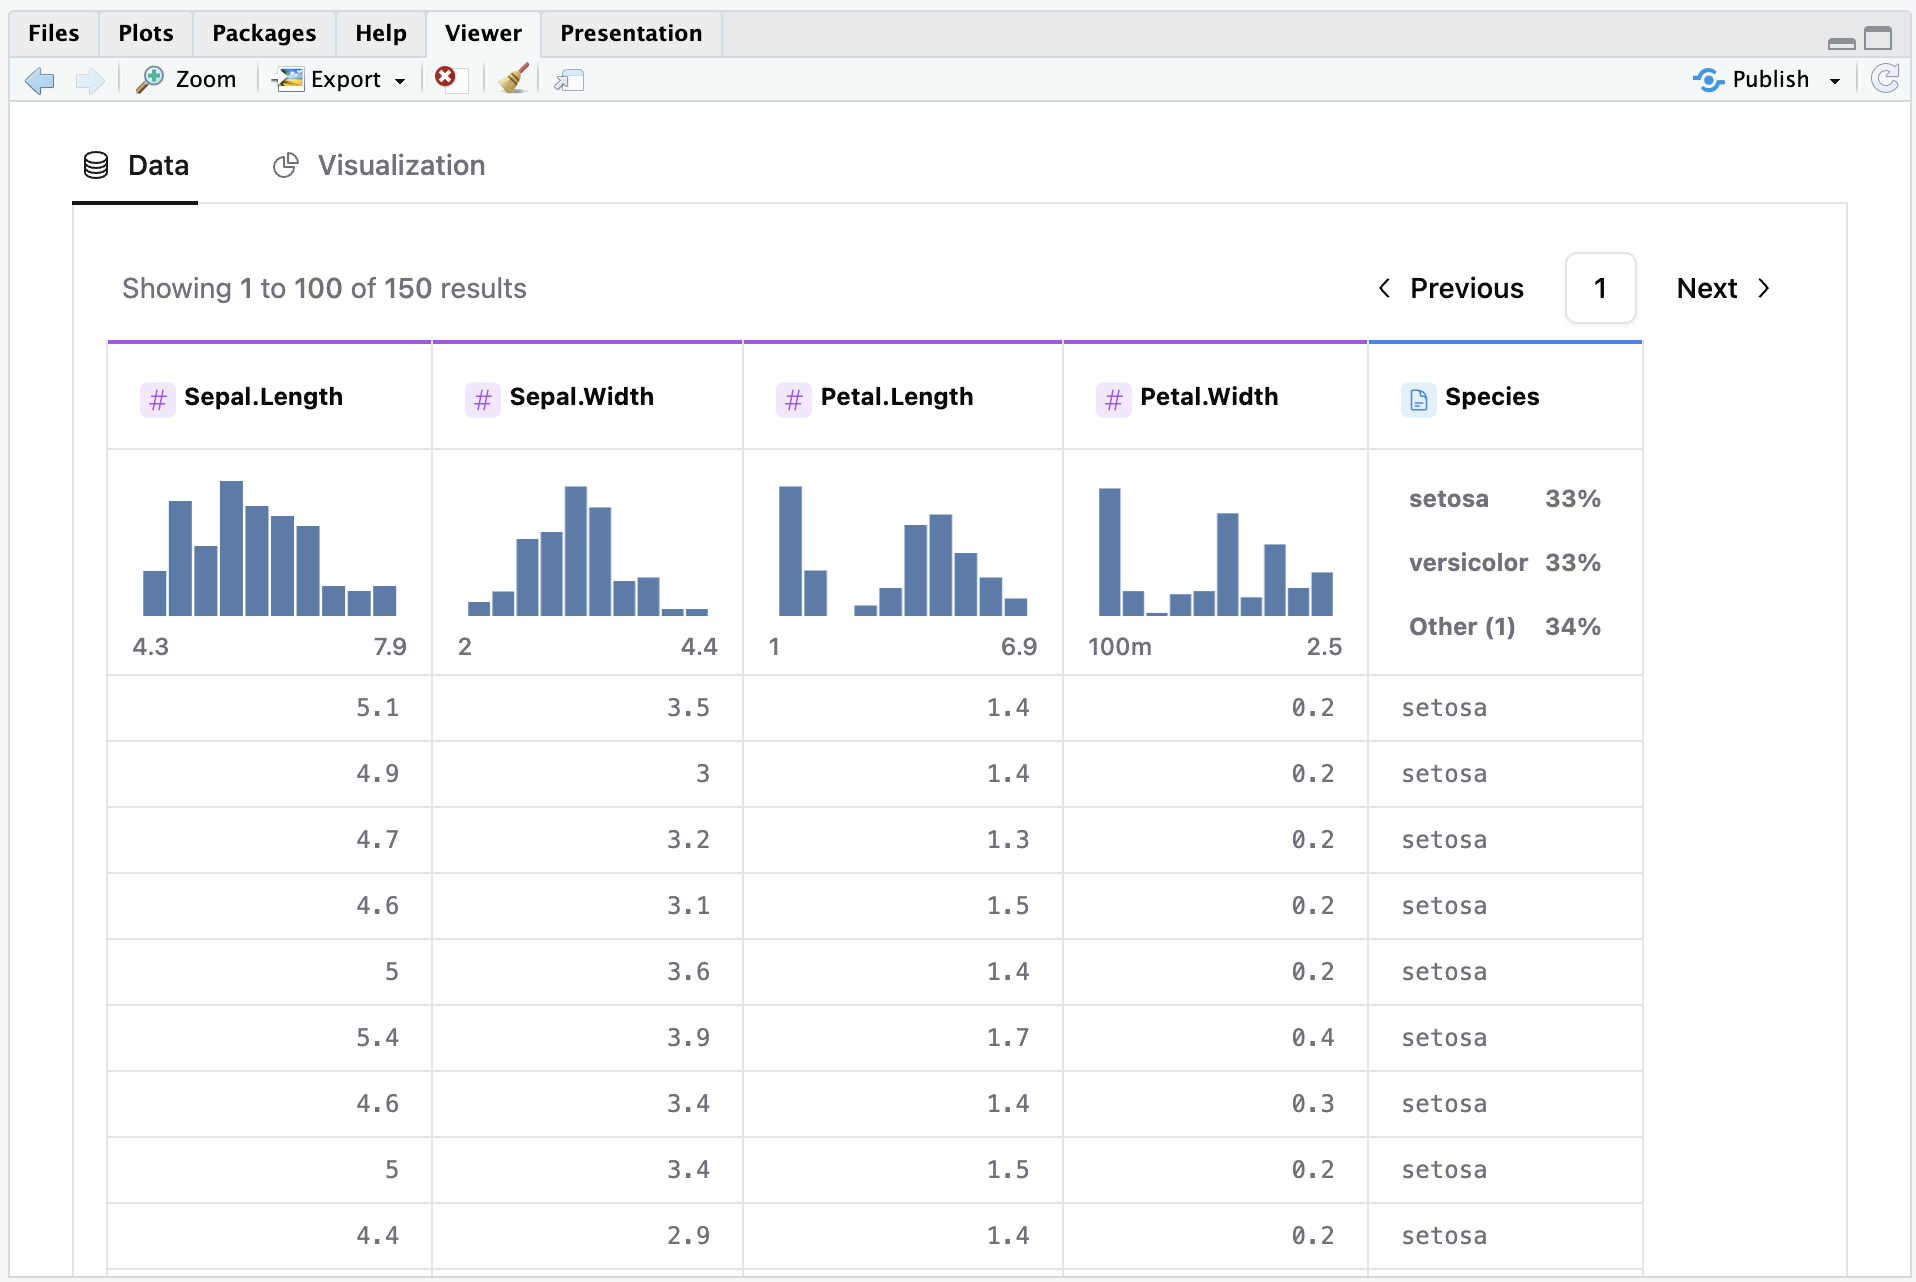
Get an overview of your data frame under 'Data' tab.
Creat data viz with simple drag-and-drop operations.
Find interesting data points? Brush them and zoom in!
Empower your R notebook (R Markdown).
Showcase your data insights with editable and explorable charts on a webpage (example)!

Development
We encourage developers from the amazing open-source community to help improve this R package!
Because the built web library is not tracked by git, the source code here is not directly runnable.
Please follow the steps below to run the source code on your own device:
- Run
git clone https://github.com/Kanaries/GWalkR.git to clone this repository.
- Go to
/web_app and yarn install.
- You can now implement your features either in the web app by changing the TypeScript code, or in the R scripts under
/R.
- Run
yarn run build to build the web app, and make sure the built library can be found under /inst/htmlwidgets/lib/.
- In R Studio, run
devtools::load_all("{DIR_OF_GWALKR}") to load the package (make sure you've removed the installed GWalkR from CRAN before that).
For more information about R package development, please refer to this book, R Packages.
Try the GWalkR package in your browser
Any scripts or data that you put into this service are public.
GWalkR documentation built on Oct. 2, 2024, 9:14 a.m.
R Package Documentation
Browse R Packages
We want your feedback!
Note that we can't provide technical support on individual packages. You should contact the package authors for that.
![]()
GWalkR: Your One-Stop R Package for Exploratory Data Analysis with Visualization
![]()
Start Exploratory Data Analysis (EDA) in R with a Single Line of Code! GWalkR is an interactive Exploratory Data Analysis (EDA) Tool in R. It integrates the htmlwidgets with Graphic Walker. It can simplify your R data analysis and data visualization workflow, by turning your data frame into a Tableau-style User Interface for visual exploration.
If you prefer using Python, you can check out PyGWalker!
Getting Started
Setup GWalkR
install.packages("GWalkR")
library(GWalkR)
Start Your Data Exploration in a Single Line of Code
data(iris)
gwalkr(iris)
Main Features
Get an overview of your data frame under 'Data' tab.
Creat data viz with simple drag-and-drop operations.
Find interesting data points? Brush them and zoom in!
Empower your R notebook (R Markdown).
Showcase your data insights with editable and explorable charts on a webpage (example)!
Development
We encourage developers from the amazing open-source community to help improve this R package!
Because the built web library is not tracked by git, the source code here is not directly runnable. Please follow the steps below to run the source code on your own device:
- Run
git clone https://github.com/Kanaries/GWalkR.gitto clone this repository. - Go to
/web_appandyarn install. - You can now implement your features either in the web app by changing the TypeScript code, or in the R scripts under
/R. - Run
yarn run buildto build the web app, and make sure the built library can be found under/inst/htmlwidgets/lib/. - In R Studio, run
devtools::load_all("{DIR_OF_GWALKR}")to load the package (make sure you've removed the installed GWalkR from CRAN before that).
For more information about R package development, please refer to this book, R Packages.
Try the GWalkR package in your browser
Any scripts or data that you put into this service are public.
R Package Documentation
Browse R Packages
We want your feedback!
Note that we can't provide technical support on individual packages. You should contact the package authors for that.
Embedding an R snippet on your website
Add the following code to your website.
For more information on customizing the embed code, read Embedding Snippets.