Nothing
README.md
In PRISMA2020: Make Interactive 'PRISMA' Flow Diagrams


PRISMA2020 Flow Diagram 
You can use this package to produce a flow diagram that conforms to the PRISMA 2020 standards using the PRISMA_flowdiagram() function. The data can be manually entered into the function, or loaded up using the template CSV file provided in 'INST/EXTDATA/'. The function, (if 'interactive = TRUE') produces an interactive HTML ouput with each box linking to a specific page (e.g. of search results or methods details), and hover-over tooltips for further information.
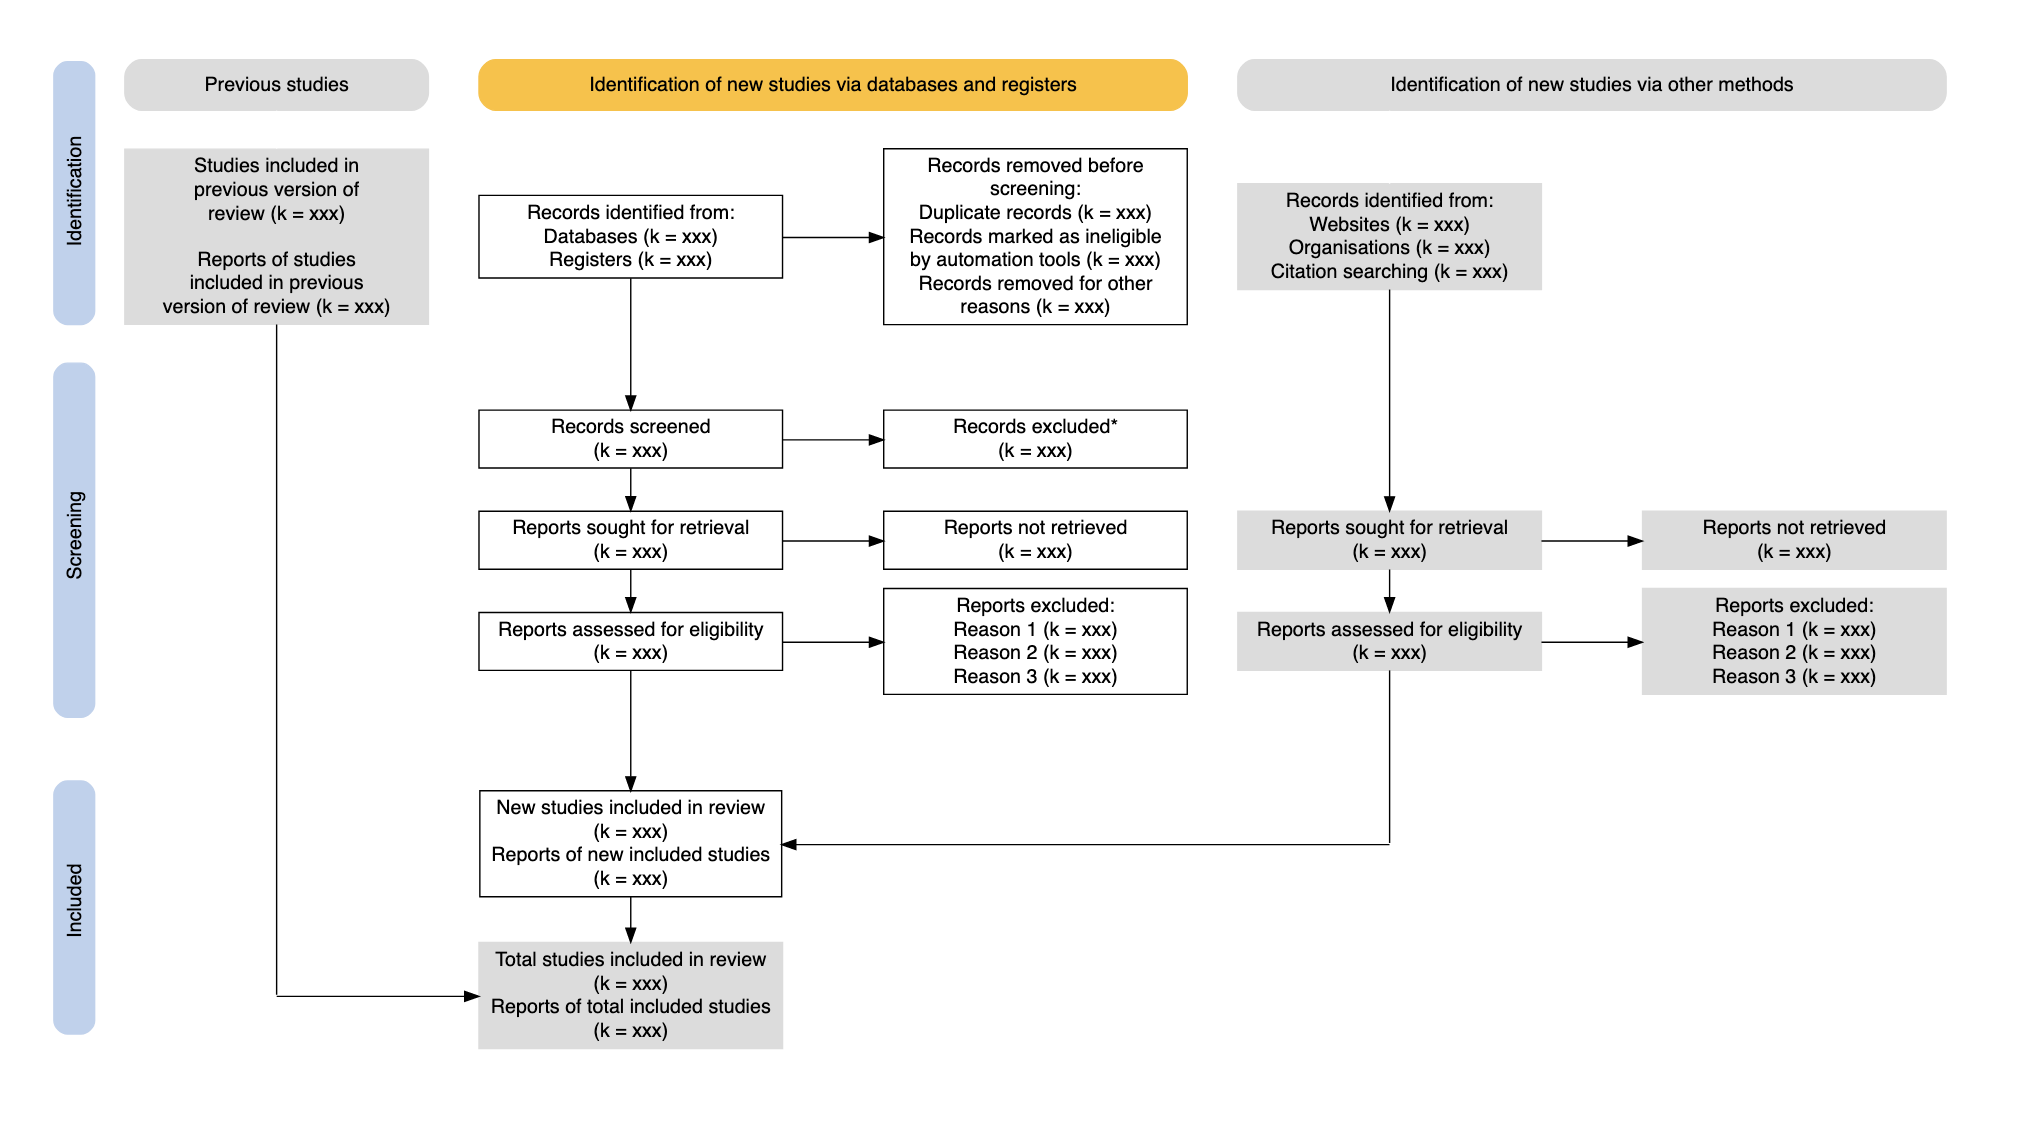
The 'Previous' and 'Other' study arms of the flowchart can be toggled on and off and removed or added to the diagram by specifying this in the function inputs.
A static version is produced otherwise.
See the interactive template here.
Visit the web-based Shiny app for a point-and-click user interface here.
Docker Installation
You can quickly install the PRISMA2020 package and run the included
example shinyapp using Docker.
docker build . -t prisma-shiny:1
docker run -it --rm -p 3838:3838 prisma-shiny:1
Then visit http://localhost:3838/app in your web browser.
To stop the app, press Ctrl+C in the terminal.
Please cite as:
Haddaway, N. R., Page, M. J., Pritchard, C. C., & McGuinness, L. A. (2022). PRISMA2020: An R package and Shiny app for producing PRISMA 2020-compliant flow diagrams, with interactivity for optimised digital transparency and Open Synthesis. Campbell Systematic Reviews, 18, e1230. https://doi.org/10.1002/cl2.1230
Citation in .ris format (right click 'Save Link As')
Try the PRISMA2020 package in your browser
Any scripts or data that you put into this service are public.
PRISMA2020 documentation built on Feb. 16, 2023, 5:12 p.m.
R Package Documentation
Browse R Packages
We want your feedback!
Note that we can't provide technical support on individual packages. You should contact the package authors for that.
![]()
![]()
![]()
PRISMA2020 Flow Diagram
You can use this package to produce a flow diagram that conforms to the PRISMA 2020 standards using the PRISMA_flowdiagram() function. The data can be manually entered into the function, or loaded up using the template CSV file provided in 'INST/EXTDATA/'. The function, (if 'interactive = TRUE') produces an interactive HTML ouput with each box linking to a specific page (e.g. of search results or methods details), and hover-over tooltips for further information.
The 'Previous' and 'Other' study arms of the flowchart can be toggled on and off and removed or added to the diagram by specifying this in the function inputs.
A static version is produced otherwise.
See the interactive template here.
Visit the web-based Shiny app for a point-and-click user interface here.
Docker Installation
You can quickly install the PRISMA2020 package and run the included example shinyapp using Docker.
docker build . -t prisma-shiny:1
docker run -it --rm -p 3838:3838 prisma-shiny:1
Then visit http://localhost:3838/app in your web browser.
To stop the app, press Ctrl+C in the terminal.
Please cite as: Haddaway, N. R., Page, M. J., Pritchard, C. C., & McGuinness, L. A. (2022). PRISMA2020: An R package and Shiny app for producing PRISMA 2020-compliant flow diagrams, with interactivity for optimised digital transparency and Open Synthesis. Campbell Systematic Reviews, 18, e1230. https://doi.org/10.1002/cl2.1230 Citation in .ris format (right click 'Save Link As')
Try the PRISMA2020 package in your browser
Any scripts or data that you put into this service are public.
R Package Documentation
Browse R Packages
We want your feedback!
Note that we can't provide technical support on individual packages. You should contact the package authors for that.
Embedding an R snippet on your website
Add the following code to your website.
For more information on customizing the embed code, read Embedding Snippets.