Nothing
Plot to present the VCaP cancer cell line
In circlizePlus: Using 'ggplot2' Feature to Write Readable R Code for Circular Visualization
knitr::opts_chunk$set(
  collapse = TRUE,
  comment = "#>"
)
Code
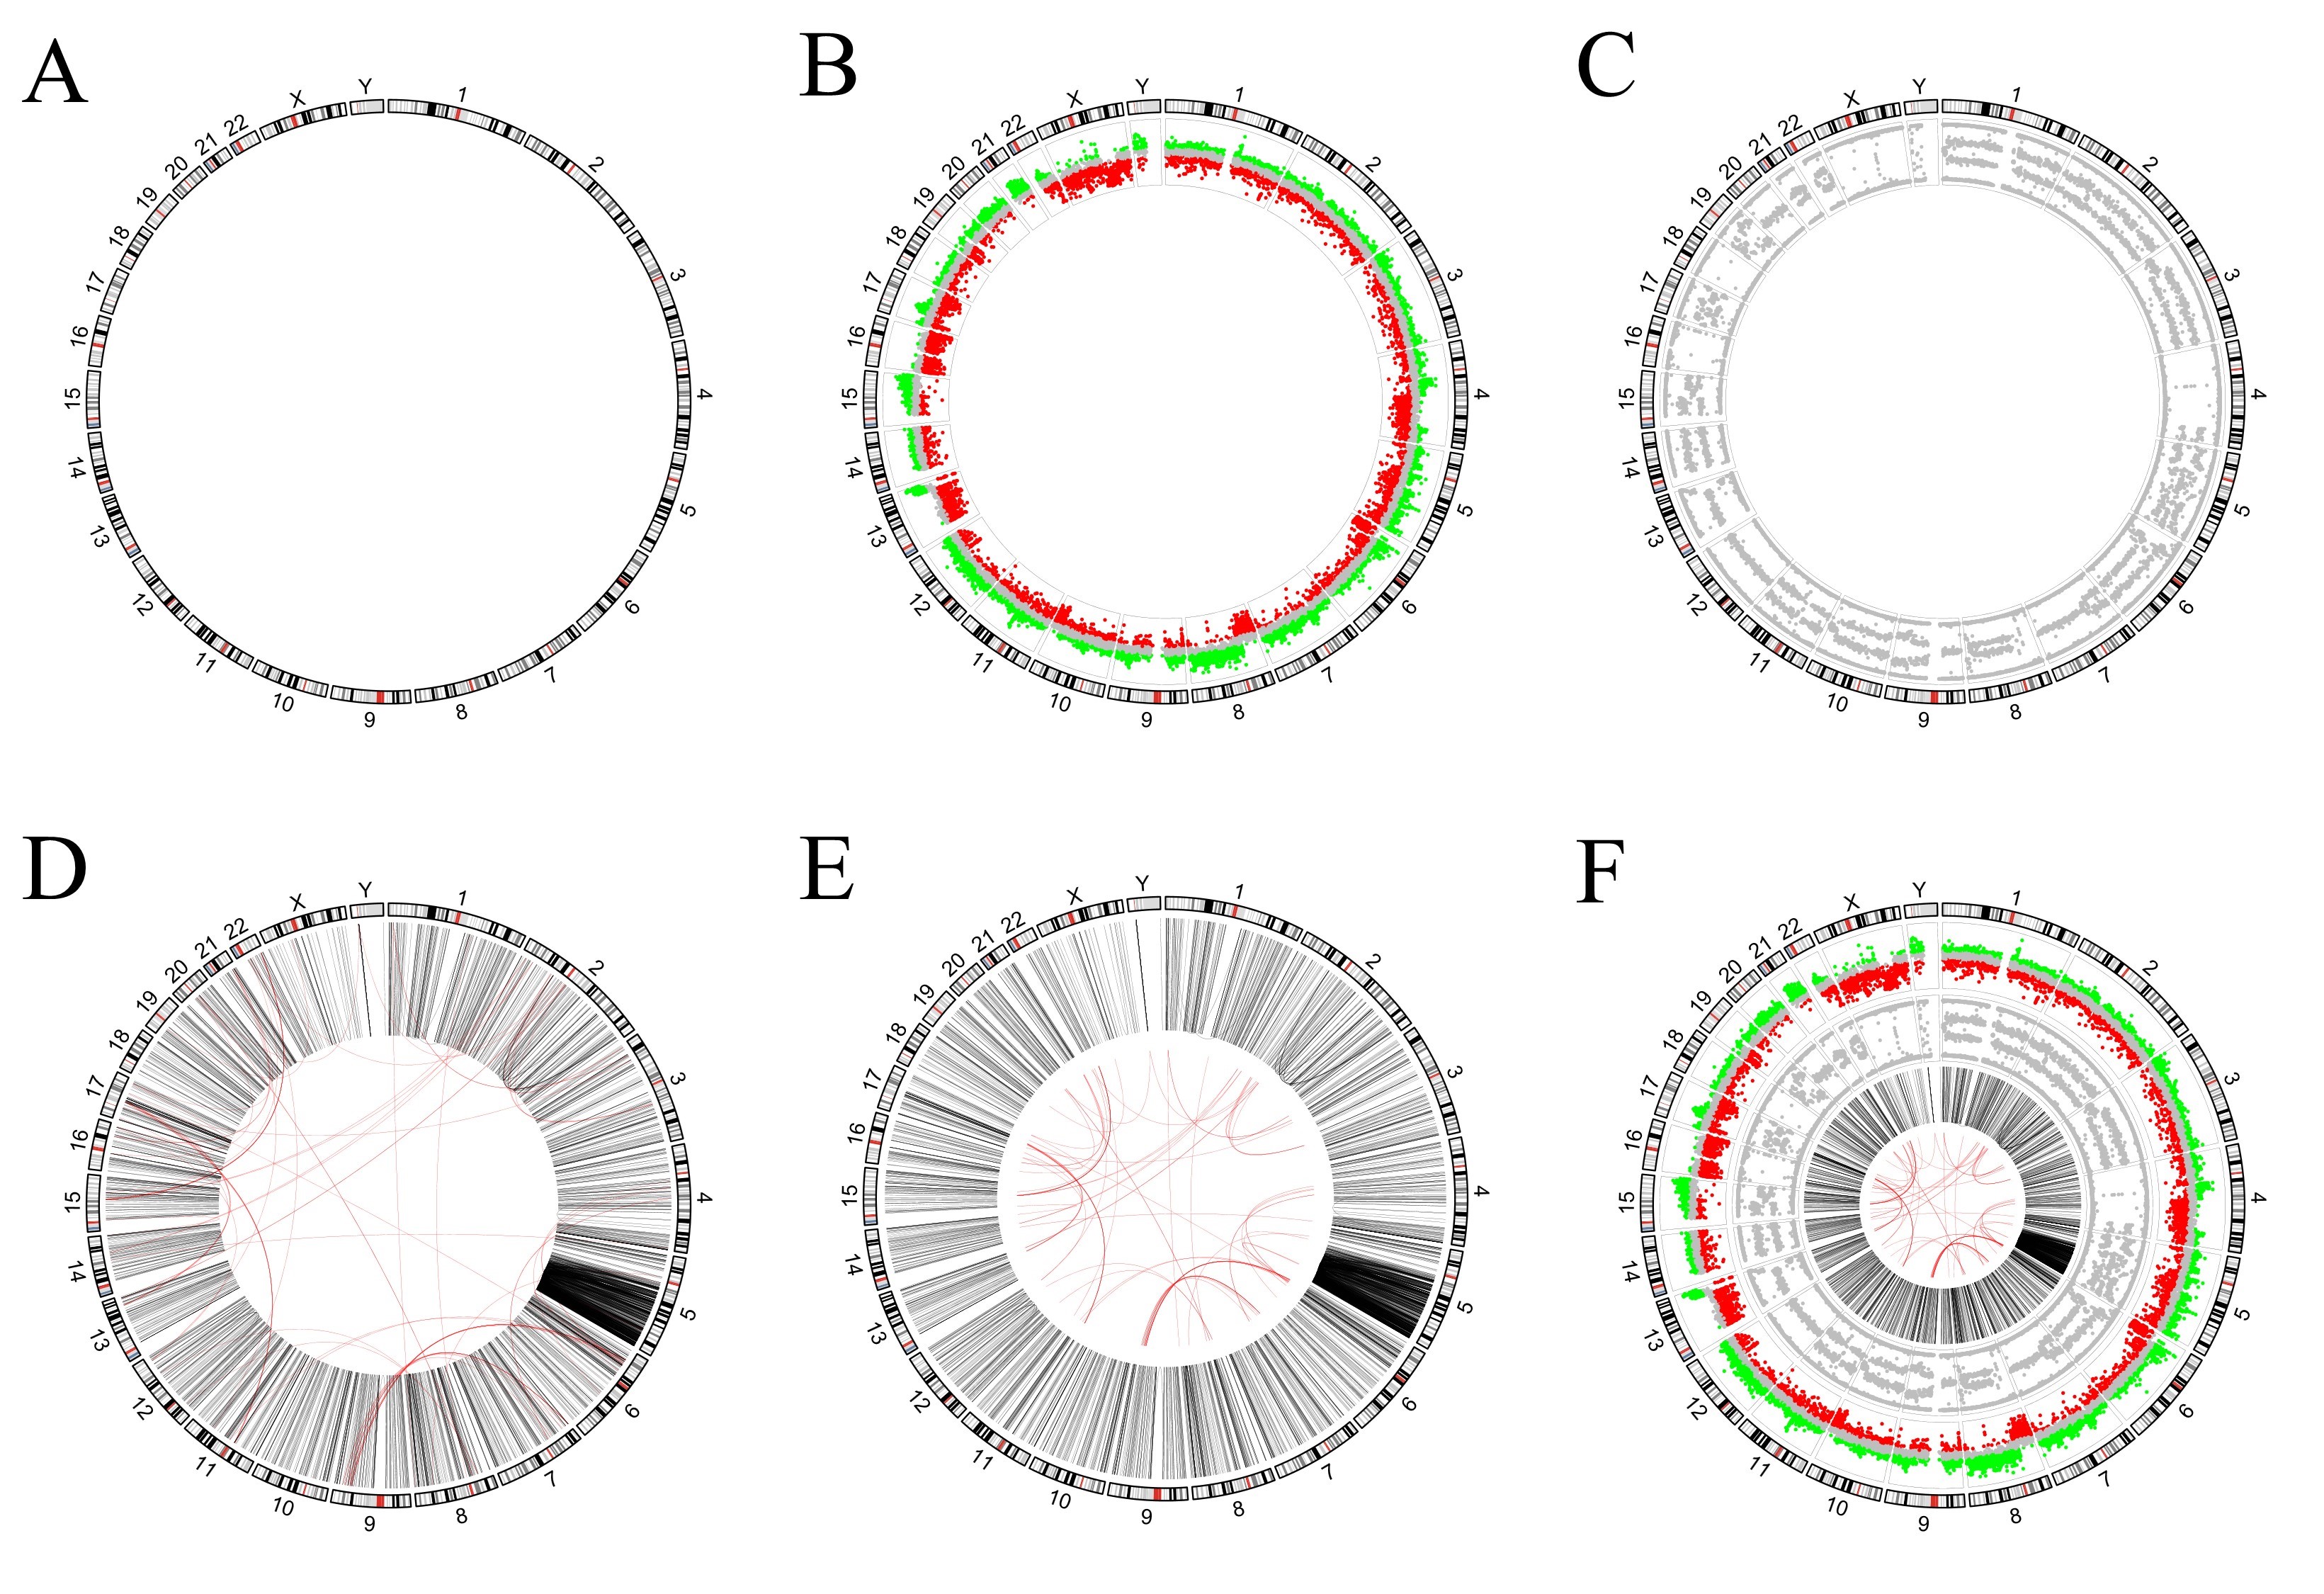
In this section, we try to draw pictures from real publications. The literature (Alves et al., 2013) uses a plot similar to Figure to present the VCaP cancer cell line. The outermost ring corresponds to human chromosome ideograms (Figure A). It serves as an X-axis to indicate the position of the data of other rings on the chromosome. The inner ring in Figure B represents the number of gene copies, and the value of each dot is from the Affymetrix SNP arrays. Its Y-axis range is −1 to 1, where dots from 0.15 to 1 are marked in red, dots from −0.15 to 0.15 are marked in grey, and dots from −1 to 0.15 are marked in green. The inner ring in Figure C represents the B-allele frequency (ratio), which ranges from 0 to 1 on the Y-axis. The links plot is used to reflect structural variations (SVs) (Figure D). The intra- and inter-chromosomal SVs are on the inner rings and depicted in black and red lines, respectively. The red link lines are obscured by the black link lines because there are quite a few intra-chromosomal SVs. The red link lines have been reduced in scale (Figure E) for aesthetic reasons. Combining all of the above plots together gives the picture in the literature (Figure F).
library(circlizePlus)
params = ccPar(start.degree=90)
data("example2")
#Fig. A
cc = ccPlot(initMode="initializeWithIdeogram", species ="hg18", plotType = c("ideogram",  "labels"))
cc + params
#Fig. B
copy_number_track=ccGenomicTrack(data=copy_number, ylim=c(-1,1), numeric.column = 4, bg.lwd=0.1, panel.fun = function(region, value, ...) {
    colors=value
    colors$col="gray"
    colors[colors$Value < -0.15,]$col="red"
    colors[colors$Value > 0.15,]$col="green"
    circos.genomicPoints(region, value, pch=20,cex=0.1, col = colors$col,...)
})
cc + params + copy_number_track
#Fig. C
allele_frequency_track=ccGenomicTrack(data=allele_frequency, ylim=c(0,1), numeric.column = 4, bg.lwd=0.1)
all_cell = ccCells(sector.indexes = unique(allele_frequency[[1]])) + ccGenomicPoints(pch=20,cex=0.1,col="gray")
allele_frequency_track=allele_frequency_track+all_cell
cc + params + allele_frequency_track
#Fig. D
junctions$col="black"
junctions[junctions$LeftChr!=junctions$RightChr,]$col="red"
links = ccGenomicLink(region1=r1, region2=r2,col=junctions$col,h.ratio=0.6, lwd=0.1)
cc + params + links
#Fig. E
junctions$rou=0.85
junctions[junctions$LeftChr!=junctions$RightChr,]$rou=0.45
links = ccGenomicLink(region1=r1, region2=r2,col=junctions$col,h.ratio=0.6, lwd=0.1, rou=junctions$rou)
cc + params + links
#Fig. F
junctions$rou=0.42
junctions[junctions$LeftChr!=junctions$RightChr,]$rou=0.22
links = ccGenomicLink(region1=r1, region2=r2,col=junctions$col,h.ratio=0.6, lwd=0.1, rou=junctions$rou)
cc + params +copy_number_track + allele_frequency_track + links
References
- Alves, I. T., Hiltemann, S., Hartjes, T., van der Spek, P., Stubbs, A., Trapman, J., et al. (2013). Gene fusions by chromothripsis of chromosome 5q in the VCaP prostate cancer cell line. Hum. Genet. 132 (6), 709–713.
- Zhang Z, Cao T, Huang Y and Xia Y (2025) CirclizePlus: using ggplot2 feature to write readable R code for circular visualization. Front. Genet. 16:1535368.
Try the circlizePlus package in your browser
Any scripts or data that you put into this service are public.
circlizePlus documentation built on June 8, 2025, 10:42 a.m.
R Package Documentation
Browse R Packages
We want your feedback!
Note that we can't provide technical support on individual packages. You should contact the package authors for that.
knitr::opts_chunk$set( collapse = TRUE, comment = "#>" )
Code
In this section, we try to draw pictures from real publications. The literature (Alves et al., 2013) uses a plot similar to Figure to present the VCaP cancer cell line. The outermost ring corresponds to human chromosome ideograms (Figure A). It serves as an X-axis to indicate the position of the data of other rings on the chromosome. The inner ring in Figure B represents the number of gene copies, and the value of each dot is from the Affymetrix SNP arrays. Its Y-axis range is −1 to 1, where dots from 0.15 to 1 are marked in red, dots from −0.15 to 0.15 are marked in grey, and dots from −1 to 0.15 are marked in green. The inner ring in Figure C represents the B-allele frequency (ratio), which ranges from 0 to 1 on the Y-axis. The links plot is used to reflect structural variations (SVs) (Figure D). The intra- and inter-chromosomal SVs are on the inner rings and depicted in black and red lines, respectively. The red link lines are obscured by the black link lines because there are quite a few intra-chromosomal SVs. The red link lines have been reduced in scale (Figure E) for aesthetic reasons. Combining all of the above plots together gives the picture in the literature (Figure F).
library(circlizePlus)
params = ccPar(start.degree=90) data("example2") #Fig. A cc = ccPlot(initMode="initializeWithIdeogram", species ="hg18", plotType = c("ideogram", "labels")) cc + params #Fig. B copy_number_track=ccGenomicTrack(data=copy_number, ylim=c(-1,1), numeric.column = 4, bg.lwd=0.1, panel.fun = function(region, value, ...) { colors=value colors$col="gray" colors[colors$Value < -0.15,]$col="red" colors[colors$Value > 0.15,]$col="green" circos.genomicPoints(region, value, pch=20,cex=0.1, col = colors$col,...) }) cc + params + copy_number_track #Fig. C allele_frequency_track=ccGenomicTrack(data=allele_frequency, ylim=c(0,1), numeric.column = 4, bg.lwd=0.1) all_cell = ccCells(sector.indexes = unique(allele_frequency[[1]])) + ccGenomicPoints(pch=20,cex=0.1,col="gray") allele_frequency_track=allele_frequency_track+all_cell cc + params + allele_frequency_track #Fig. D junctions$col="black" junctions[junctions$LeftChr!=junctions$RightChr,]$col="red" links = ccGenomicLink(region1=r1, region2=r2,col=junctions$col,h.ratio=0.6, lwd=0.1) cc + params + links #Fig. E junctions$rou=0.85 junctions[junctions$LeftChr!=junctions$RightChr,]$rou=0.45 links = ccGenomicLink(region1=r1, region2=r2,col=junctions$col,h.ratio=0.6, lwd=0.1, rou=junctions$rou) cc + params + links #Fig. F junctions$rou=0.42 junctions[junctions$LeftChr!=junctions$RightChr,]$rou=0.22 links = ccGenomicLink(region1=r1, region2=r2,col=junctions$col,h.ratio=0.6, lwd=0.1, rou=junctions$rou) cc + params +copy_number_track + allele_frequency_track + links
References
- Alves, I. T., Hiltemann, S., Hartjes, T., van der Spek, P., Stubbs, A., Trapman, J., et al. (2013). Gene fusions by chromothripsis of chromosome 5q in the VCaP prostate cancer cell line. Hum. Genet. 132 (6), 709–713.
- Zhang Z, Cao T, Huang Y and Xia Y (2025) CirclizePlus: using ggplot2 feature to write readable R code for circular visualization. Front. Genet. 16:1535368.
Try the circlizePlus package in your browser
Any scripts or data that you put into this service are public.
R Package Documentation
Browse R Packages
We want your feedback!
Note that we can't provide technical support on individual packages. You should contact the package authors for that.
Embedding an R snippet on your website
Add the following code to your website.
For more information on customizing the embed code, read Embedding Snippets.