mars_screw: Intensity and saturation values of a picture from mars.
In ktaucenters: Robust Clustering Procedures
mars_screw R Documentation
Intensity and saturation values of a picture from mars.
Description
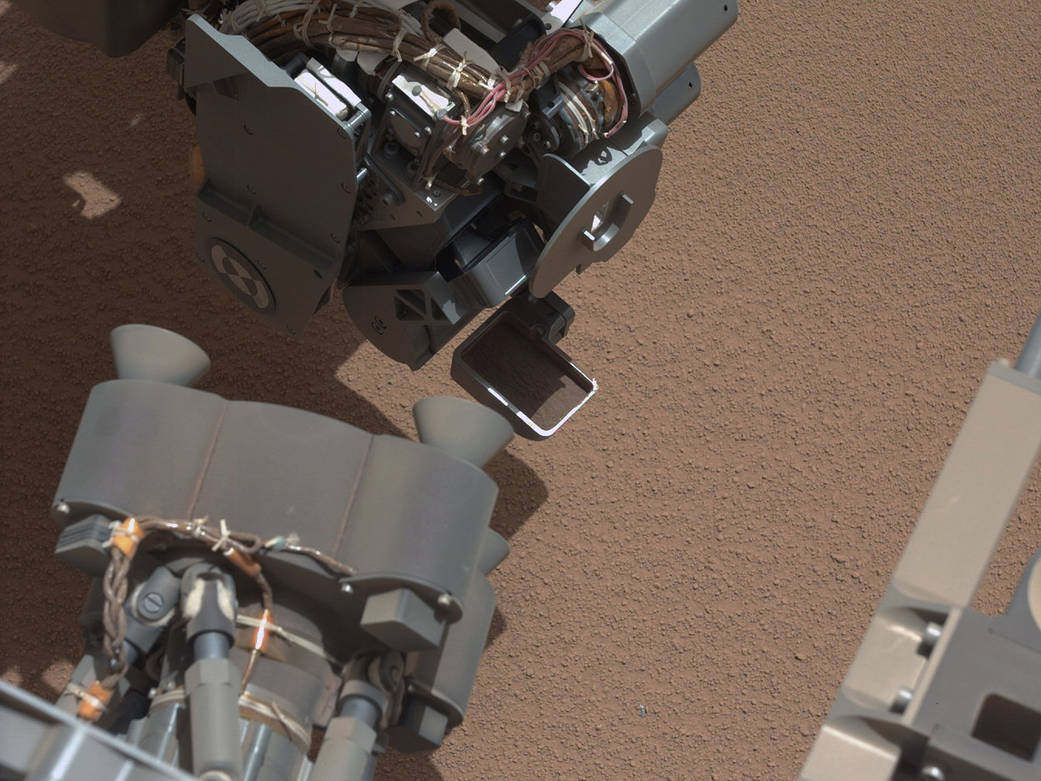
A dataset containing the Intensity and Saturation values of a picture from Mars
taken from Rover Curiosity.
Usage
mars_screw
Format
A list containing information about pixels of a picture form mars mainly
containing red sand and metal form Rover itself. List include:
SI_matrix: A matrix with 5063 rows and 128 columns.
Elements 1 to 64 of each row indicate the Saturation values of pixels in a square cell 8 x 8
whereas elements 65 to 128 of each row indicate the cell's Intensity values.
geographic_matrix: An integer matrix of dimension 5063 x 2, each row indicates
each square cell's locations (x-axis y-axis) at the picture.
screw_index: the index corresponding to the screw observation (screw_index=4180)
Source
https://www.nasa.gov/wp-content/uploads/2023/03/694811main_pia16225-43_full.jpg
ktaucenters documentation built on May 29, 2024, 5:55 a.m.
R Package Documentation
Browse R Packages
We want your feedback!
Note that we can't provide technical support on individual packages. You should contact the package authors for that.
| mars_screw | R Documentation |
Intensity and saturation values of a picture from mars.
Description
A dataset containing the Intensity and Saturation values of a picture from Mars taken from Rover Curiosity.
Usage
mars_screw
Format
A list containing information about pixels of a picture form mars mainly containing red sand and metal form Rover itself. List include:
SI_matrix: A matrix with 5063 rows and 128 columns. Elements 1 to 64 of each row indicate the Saturation values of pixels in a square cell 8 x 8 whereas elements 65 to 128 of each row indicate the cell's Intensity values.
geographic_matrix: An integer matrix of dimension 5063 x 2, each row indicates each square cell's locations (x-axis y-axis) at the picture.
screw_index: the index corresponding to the screw observation (screw_index=4180)
Source
https://www.nasa.gov/wp-content/uploads/2023/03/694811main_pia16225-43_full.jpg
R Package Documentation
Browse R Packages
We want your feedback!
Note that we can't provide technical support on individual packages. You should contact the package authors for that.
Embedding an R snippet on your website
Add the following code to your website.
For more information on customizing the embed code, read Embedding Snippets.