Nothing
Topology and Resilience
In manynet: Many Ways to Make, Modify, Map, Mark, and Measure Myriad Networks
library(learnr)
library(manynet)
library(patchwork)
knitr::opts_chunk$set(echo = FALSE)
clear_glossary()
learnr::random_phrases_add(language = "fr",
                           praise = c("C'est génial!",
                                      "Beau travail",
                                      "Excellent travail!",
                                      "Bravo!",
                                      "Super!",
                                      "Bien fait",
                                      "Bien joué",
                                      "Tu l'as fait!",
                                      "Je savais que tu pouvais le faire.",
                                      "Ça a l'air facile!",
                                      "C'était un travail de première classe.",
                                      "C'est ce que j'appelle un bon travail!"),
                          encouragement = c("Bon effort",
                                            "Vous l'avez presque maîtrisé!",
                                            "Ça avance bien.",
                                            "Continuez comme ça.",
                                            "Continuez à travailler dur!",
                                            "Vous apprenez vite!",
                                            "Vous faites un excellent travail aujourd'hui."))
learnr::random_phrases_add(language = "en",
                           praise = c("C'est génial!",
                                      "Beau travail!",
                                      "Bravo!",
                                      "Super!"),
                           encouragement = c("Bon effort"))
Overview

In this tutorial, we'll explore:
- how to create or generate different network topologies
- the core-periphery structure of a network
- features of a network related to its resilience
This tutorial covers a range of different network topologies:
trees, lattices, random, small-world, scale-free, and core-periphery
networks.
These ideal networks exaggerate centrality, cohesion, and randomness features,
and are thus great for theory-building and investigating the relationship between rules and structure.
In this practical, we're going to create/generate
a number of ideal-typical network topologies and plot them.
We'll first look at some deterministic algorithms for creating networks
of different structures,
and then look at how the introduction of some randomness can generate a variety of network structures.
Creating networks
To begin with, let's create a few 'empty' and full/'complete' graphs.
You will want to use some of the create_*() group of functions from {manynet},
because they create graphs following some strict rule(s).
The two functions you will want to use here are create_empty() and create_filled().
create_empty() creates an empty graph with the given number of nodes,
in this case 50 nodes.
For create_filled() we're creating a full graph,
where all of the nodes are connected to all of the other nodes.
Let's say that we want to explore networks of fifty nodes in this script.
Graph one empty and one complete network with 50 nodes each,
give them an informative title, and plot the graphs together.
What would a complete network with half the nodes look like?
Add that too.
(graphr(create_empty(50), "circle") + ggtitle("Empty graph"))
(graphr(create_filled(50)) + ggtitle("Complete graph"))
(graphr(create_filled(50/2)) + ggtitle("Complete graph (smaller)"))
Stars
In a star network, there is one node to which all other nodes are connected.
There is no transitivity.
The maximum path length is two.
And centrality is maximised!
This network maximises all centrality measures as one node acts
as the sole bridge connecting one part of the network to the other.
Use the create_star() function to graph three star networks:
- an undirected star network
- a out-directed star network
- and an in-directed star network
(graphr(create_star(50)) + ggtitle("Star graph"))
(graphr(create_star(50, directed = TRUE)) + ggtitle("Star out"))
(graphr(to_redirected(create_star(50, directed = TRUE))) + ggtitle("Star in"))
Trees
Trees, or regular trees, are networks with branching nodes.
They can be directed or undirected, and tend to indicate strong hierarchy.
Again graph three networks:
- one undirected with 2 branches per node
- a directed network with 2 branches per node
- the same as above, but graphed using the "tree" layout
# width argument specifies the breadth of the branches
(graphr(create_tree(50, width = 2)) + ggtitle("Tree graph"))
(graphr(create_tree(50, width = 2, directed = TRUE)) + ggtitle("Tree out"))
(graphr(create_tree(50, width = 2, directed = TRUE), "tree") + ggtitle("Tree layout"))
Try varying the width argument to see the result.
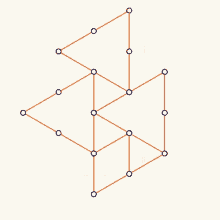
Lattices
r gloss("Lattices","lattice") reflect highly clustered networks
where there is a high likelihood that interaction partners also interact.
They are used to show how clustering facilitates or limits diffusion
or makes pockets of behaviour stable.
question("Why are lattices considered highly clustered?",
         answer("Because neighbours are likely also neighbours of each other",
                message = learnr::random_praise(),
                correct = TRUE),
         answer("Because all nodes are directly connected to each other",
                message = learnr::random_encouragement()),
         answer("Because there is a single component",
                message = learnr::random_encouragement()),
         answer("Because there is a single community",
                message = learnr::random_encouragement()),
         random_answer_order = TRUE,
         allow_retry = TRUE)
Note that create_lattice() in {manynet} works a little differently
to how it works in {igraph}.
In {igraph} the number or vector passed to the function indicates
the length of each dimension.
So c(50) would be a one-dimensional lattice,
essentially a chain of 50 nodes connected to their neighbours.
c(50,50) would be a two-dimensional lattice,
of 50 nodes long and 50 nodes wide.
c(50,50,50) would be a three-dimensional lattice,
of 50 nodes long, 50 nodes wide, and 50 nodes deep, etc.
But this doesn't help us when we want to see what a lattice representation
with the same order (number of nodes) as a given network would be.
For example, perhaps we just want to know what a lattice with 50 nodes
would look like.
So {manynet} instead tries to find the most even or balanced
two-dimensional representation with a given number of nodes.
Graph two lattices, one with 50 nodes,
and another with half the number of nodes.
(graphr(create_lattice(50)) + ggtitle("One-mode lattice graph"))
(graphr(create_lattice(50/2)) + ggtitle("Smaller lattice graph"))
Rings
This creates a graph where each node has two separate neighbours
which creates a ring graph.
Graph three ring networks:
- one with 50 nodes
- one with 50 nodes where they are connected to neighbours two steps away,
on a "circle" layout
- the same as above, but on a "stress" layout
(graphr(create_ring(50)) + ggtitle("Ring graph", subtitle = "Starring Naomi Watts"))
# width argument specifies the width of the ring
(graphr(create_ring(50, width = 2), "circle") + ggtitle("The Ring Two", subtitle = "No different?"))
(graphr(create_ring(50, width = 2), "stress") + ggtitle("The Ring Two v2.0"))
Generating networks
Next we are going to take a look at some probabilistic graphs.
These involve some random element, perhaps in addition to specific rules,
to stochastically 'generate' networks of certain types of topologies.
As such, we'll be using the generate_*() group of functions from {manynet}.
Random graphs
An Erdös-Renyi graph is simply a random graph.
You will need to specify the probability of a tie
in addition to the number of nodes.
An Erdos-Renyi graph on the vertex set $V$ is a random graph
which connects each pair of nodes ${i,j}$ with probability $p$, independent.
Note that for a “sparse” ER graphs, $p$ must decrease as $N$ goes up.
Generate three random networks of 50 nodes and a density of 0.08:
(graphr(generate_random(50, 0.08)) + ggtitle("Random 1 graph"))
(graphr(generate_random(50, 0.08)) + ggtitle("Random 2 graph"))
(graphr(generate_random(50, 0.08)) + ggtitle("Random 3 graph"))
Keep going if you like... it will be a little different every time.
Note that you can also pass the second argument an integer,
in which case the function will interpret that as the number of ties/edges rather than the probability that a tie is present.
Try generating a random graph with 200 edges/ties now:
(erdren4 <- graphr(generate_random(50, 200)) + ggtitle("Random 1 graph"))
Small-world graphs
Remember the ring graph from above?
What if we rewire (change) some of the edges at a certain probability?
This is how small-world networks are generated.
Graph three small-world networks, all with 50 nodes and a rewiring probability of 0.025.
(graphr(generate_smallworld(50, 0.025)) + ggtitle("Smallworld 1 graph"))
(graphr(generate_smallworld(50, 0.025)) + ggtitle("Smallworld 2 graph"))
(graphr(generate_smallworld(50, 0.025)) + ggtitle("Smallworld 3 graph"))
With on average 2.5 ties randomly rewired, does the structure look different?
This is a small-world network, where clustering/transitivity remains high
but path lengths are much lower than they would otherwise be.
Remember that in a small-world network, the shortest-path distance between nodes
increases sufficiently slowly as a function of the number of nodes in the network.
You can also call these networks a Watts–Strogatz toy network.
If you want to review this, go back to the reading by Watts (2004).
There is also such a thing as a network's small-world coefficient.
See the help page for more details,
but with the default equation ('omega'),
the coefficient typically ranges between 0 and 1,
where 1 is as close to a small-world as possible.
Try it now on a small-world generated network,
but with a rewiring probability of 0.25:
net_smallworld(generate_smallworld(50, 0.25))
Scale-free graphs
There is another famous model in network science: the scale-free model.
Remember:
"In many real-world networks, the distribution of the number of network neighbours
the degree distribution is typically right-skewed with a "heavy tail".
A majority of the nodes have less-than-average degree and
a small fraction of hubs are many times better connected than average (2004, p. 250).
The following generates a scale-free graph according to the Barabasi-Albert (BA) model
that rests upon the mechanism of preferential attachment.
More on this in the Watts paper (2005, p.51) and Merton (1968).
The BA model rests on two mechanisms:
population growth and preferential attachment.
Population growth: real networks grow in time as new members join the population.
Preferential/cumulative attachment means that newly arriving nodes will tend to
connect to already well-connected nodes rather than poorly connected ones.
Generate and graph three scale-free networks,
with alpha parameters of 0.5, 1, and 1.5.
(graphr(generate_scalefree(50, 0.5)) +
    ggtitle("Scalefree 1 graph", subtitle = "Power = .5"))
(graphr(generate_scalefree(50, 1)) +
    ggtitle("Scalefree 2 graph", subtitle = "Power = 1"))
(graphr(generate_scalefree(50, 1.5)) +
    ggtitle("Scalefree 3 graph", subtitle = "Power = 1.5"))
You can also the degree to which a network has a degree distribution that fits
a power-law distribution.
With an alpha/power-law exponent between 2 and 3,
one generally cannot reject the hypothesis that the observed data
comes from a power-law distribution.
net_scalefree(generate_scalefree(50, 2))
Core-Periphery
Core-periphery graphs
Lastly, we'll take a look at some core-periphery graphs.
The most common definition of a core-periphery network
is one in which the network can be partitioned into two groups
such that one group of nodes (the core) has
dense interactions among themselves,
moderately dense interactions with the second group,
and the second group (the periphery) has
sparse interactions among themselves.
question("Can a single network have both a community structure and a core-periphery structure?",
         answer("No", message = learnr::random_encouragement()),
         answer("Yes",
                message = "That's right. For example, the core and periphery might represent two or more communities.",
                correct = TRUE),
         random_answer_order = TRUE,
         allow_retry = TRUE)
We can visualise extreme versions of such a network
using the create_core() function.
Graph a core-periphery network of 50 nodes
(which, unless a core-periphery membership assignment is given,
will be split evenly between core and periphery partitions).
(graphr(create_core(50)) + ggtitle("Core"))
Core-periphery assignment
Let's consider identifying the core and peripheral nodes in a network.
Let's use the ison_lawfirm dataset from {manynet}.
This dataset involves relations between partners in a corporate law firm in New England.
First of all, graph the data and see whether you can guess which nodes
might be part of the core and which are part of the periphery.
Color the nodes by Gender, Office, Practice, and School.
Any you might think correlate with core status?
lawfirm <- ison_lawfirm |> to_uniplex("friends") |> to_undirected()
lawfirm <- ison_lawfirm |> to_uniplex("friends") |> to_undirected()
graphr(lawfirm, node_color = "school", edge_color = "darkgray")
graphr(lawfirm, node_color = "gender", edge_color = "darkgray")
graphr(lawfirm, node_color = "office", edge_color = "darkgray")
graphr(lawfirm, node_color = "practice", edge_color = "darkgray")
Next, let's assign nodes to the core and periphery blocks
using the node_is_core() function.
It works pretty straightforwardly.
By default it runs down the rank order of nodes by their degree,
at each step working out whether including the next highest degree node
in the core will maximise the core-periphery structure of the network.
lawfirm %>%
  mutate(nc = node_is_core()) %>%
  graphr(node_color = "nc", edge_color = "gray")
This graph suggests that there is a core and a periphery.
There might even be two cores here,
one on the left and one on the right.
But is it really all that much of a core-periphery structure?
We can establish how correlated our network is compared to
a core-periphery model of the same dimension using net_core().
net_core(lawfirm, node_is_core(lawfirm))
question("What can we say about this correlation.",
         answer("It is a perfect negative relationship",
                message = learnr::random_encouragement()),
         answer("It is fairly strong",
                message = learnr::random_encouragement()),
         answer("It is positive",
                message = learnr::random_encouragement()),
         answer("There is absolutely no correlation",
                message = learnr::random_encouragement()),
         answer("None of the above", correct = TRUE,
                message = learnr::random_praise()),
         allow_retry = TRUE
)
Note that node_is_core() also includes a method that descends through
the rank order of nodes' eigenvector centralities instead of degree centralities.
Why might that not be such a good choice here?
Now let's see whether our core-periphery membership vector correlates with any of the three
categorical attributes we looked at before.
Since we're doing this on categorical variables, we'll use the Chi-squared test in base R.
Take a look and see whether there is a statistically significant association
between gender and core (or periphery) status.
chisq.test(as.factor(node_is_core(lawfirm)),
           as.factor(node_attribute(lawfirm, "gender")))
chisq.test(as.factor(node_is_core(lawfirm)),
           as.factor(node_attribute(lawfirm, "gender")))
chisq.test(as.factor(node_is_core(lawfirm)),
           as.factor(node_attribute(lawfirm, "office")))
chisq.test(as.factor(node_is_core(lawfirm)),
           as.factor(node_attribute(lawfirm, "school")))
chisq.test(as.factor(node_is_core(lawfirm)),
           as.factor(node_attribute(lawfirm, "practice")))
question("There a statistically significant association between the core assignment and...",
         answer("gender.",
                message = learnr::random_encouragement()),
         answer("office.",
                message = learnr::random_encouragement()),
         answer("school.",
                message = learnr::random_encouragement()),
         answer("practice.",
                message = learnr::random_encouragement()),
         answer("none of the above variables.", correct = TRUE,
                message = "That's right. The p-value for office is close, but no cigar."),
         allow_retry = TRUE
)
Coreness
An alternative route is to identify 'core' nodes
depending on their k-coreness.
In {manynet}, we can return nodes k-coreness
with node_coreness() instead of
the node_is_core() used for core-periphery.
lawfirm %>%
  mutate(ncn = node_coreness()) %>%
  graphr(node_color = "ncn")
question("Which has more than two classes/groups.",
         answer("node_coreness()", correct = TRUE,
                message = learnr::random_praise()),
         answer("node_is_core()",
                message = learnr::random_encouragement()),
         random_answer_order = TRUE,
         allow_retry = TRUE
)
question("Select the correct definitions:",
         answer("The k-core of a network is a maximal subgraph in which each vertex has at least degree k.", correct = TRUE,
                message = learnr::random_praise()),
         answer("The coreness of a node is k if it belongs to the k-core but not to the (k+1)-core.", correct = TRUE),
         answer("The coreness of a node is equal to its degree.",
                message = learnr::random_encouragement()),
         random_answer_order = TRUE,
         allow_retry = TRUE
)
Resilience
How cohesive is the network?
When investigating a network's resilience,
we might think of whether the network will remain connected despite some nodes or ties dropping out.
Let's explore how resilient a (core) network of adolescents (ison_adolescents) might be.
First, we might be interested in whether the network is connected at all.
net_connectedness(ison_adolescents)
This measure gets at the proportion of dyads that can reach each other in the network.
In this case, the proportion is 1, i.e. all nodes can reach every other node.
Another way to get at this would be to see how many components there are in the network.
question("But counting the number of components instead of connectedness can overemphasise:",
         answer("Isolates", correct = TRUE,
                message = learnr::random_praise()),
         answer("Small components", correct = TRUE,
                message = learnr::random_encouragement()),
         answer("Density",
                message = learnr::random_encouragement()),
         random_answer_order = TRUE,
         allow_retry = TRUE
)
A dropped tie can have severe consequences to the topology of a network
if it is a bridge, say.
But a dropped node can be even more consequential, as it will take any ties it has with it.
Find out how many dropped nodes it would take to (further) fragment the network.
net_cohesion(ison_adolescents)
question("The result of this function represents...",
         answer("the minimum number of nodes necessary to remove from the network to increase the number of components.", correct = TRUE,
                message = learnr::random_praise()),
         answer("the number of strong components in the network.",
                message = learnr::random_encouragement()),
         answer("the minimum number of ties necessary to remove from the network to increase the number of components.",
                message = "This is actually the definition of `node_adhesion()`."),
         random_answer_order = TRUE,
         allow_retry = TRUE
)
question("The higher the minimum number of nodes to remove...",
         answer("the more resilient is the network.", correct = TRUE,
                message = learnr::random_praise()),
         answer("the less resilient the network.",
                message = learnr::random_encouragement()),
         random_answer_order = TRUE,
         allow_retry = TRUE
)
Identifying cutpoints
But which are these nodes? Is there more than one?
Nodes that endanger fragmentation of the network are called r gloss("cutpoints","cutpoint").
Find and use a function to identify which, if any, of the nodes in the ison_adolescents
network are cutpoints.
node_is_cutpoint(ison_adolescents)
Ok, so this results in a vector identifying which nodes are cutpoints (TRUE) or not (FALSE).
Somewhat more useful though would be to highlight these nodes on the network.
Can you add a node attribute that highlights which nodes are cutpoints?
ison_adolescents |> mutate(cut = node_is_cutpoint(ison_adolescents)) |>
  graphr(node_color = "cut")
Identifying bridges
Let's do something similar now, but with respect to ties rather than nodes.
Here we are interested in identifying which ties are r gloss("bridges","bridge").
net_adhesion(ison_adolescents)
ison_adolescents |> mutate_ties(cut = tie_is_bridge(ison_adolescents)) |>
  graphr(edge_color = "cut")
We could also investigate the opposite of a bridge,
the degree to which ties are deeply embedded in triangles.
This is called (rather confusingly) tie cohesion.
ison_adolescents |> mutate_ties(coh = tie_cohesion(ison_adolescents)) |>
  graphr(edge_size = "coh")
Where would you target your efforts if you wanted to fragment this network?
Free play
Glossary
Here are some of the terms that we have covered in this module:
r print_glossary()
Try the manynet package in your browser
Any scripts or data that you put into this service are public.
manynet documentation built on June 23, 2025, 9:07 a.m.
R Package Documentation
Browse R Packages
We want your feedback!
Note that we can't provide technical support on individual packages. You should contact the package authors for that.
library(learnr) library(manynet) library(patchwork) knitr::opts_chunk$set(echo = FALSE) clear_glossary() learnr::random_phrases_add(language = "fr", praise = c("C'est génial!", "Beau travail", "Excellent travail!", "Bravo!", "Super!", "Bien fait", "Bien joué", "Tu l'as fait!", "Je savais que tu pouvais le faire.", "Ça a l'air facile!", "C'était un travail de première classe.", "C'est ce que j'appelle un bon travail!"), encouragement = c("Bon effort", "Vous l'avez presque maîtrisé!", "Ça avance bien.", "Continuez comme ça.", "Continuez à travailler dur!", "Vous apprenez vite!", "Vous faites un excellent travail aujourd'hui.")) learnr::random_phrases_add(language = "en", praise = c("C'est génial!", "Beau travail!", "Bravo!", "Super!"), encouragement = c("Bon effort"))
Overview
In this tutorial, we'll explore:
- how to create or generate different network topologies
- the core-periphery structure of a network
- features of a network related to its resilience
This tutorial covers a range of different network topologies: trees, lattices, random, small-world, scale-free, and core-periphery networks. These ideal networks exaggerate centrality, cohesion, and randomness features, and are thus great for theory-building and investigating the relationship between rules and structure.
In this practical, we're going to create/generate a number of ideal-typical network topologies and plot them. We'll first look at some deterministic algorithms for creating networks of different structures, and then look at how the introduction of some randomness can generate a variety of network structures.
Creating networks
To begin with, let's create a few 'empty' and full/'complete' graphs.
You will want to use some of the create_*() group of functions from {manynet},
because they create graphs following some strict rule(s).
The two functions you will want to use here are create_empty() and create_filled().
create_empty() creates an empty graph with the given number of nodes,
in this case 50 nodes.
For create_filled() we're creating a full graph,
where all of the nodes are connected to all of the other nodes.
Let's say that we want to explore networks of fifty nodes in this script. Graph one empty and one complete network with 50 nodes each, give them an informative title, and plot the graphs together. What would a complete network with half the nodes look like? Add that too.
(graphr(create_empty(50), "circle") + ggtitle("Empty graph")) (graphr(create_filled(50)) + ggtitle("Complete graph")) (graphr(create_filled(50/2)) + ggtitle("Complete graph (smaller)"))
Stars
In a star network, there is one node to which all other nodes are connected. There is no transitivity. The maximum path length is two. And centrality is maximised! This network maximises all centrality measures as one node acts as the sole bridge connecting one part of the network to the other.
Use the create_star() function to graph three star networks:
- an undirected star network
- a out-directed star network
- and an in-directed star network
(graphr(create_star(50)) + ggtitle("Star graph")) (graphr(create_star(50, directed = TRUE)) + ggtitle("Star out")) (graphr(to_redirected(create_star(50, directed = TRUE))) + ggtitle("Star in"))
Trees
Trees, or regular trees, are networks with branching nodes. They can be directed or undirected, and tend to indicate strong hierarchy. Again graph three networks:
- one undirected with 2 branches per node
- a directed network with 2 branches per node
- the same as above, but graphed using the "tree" layout
# width argument specifies the breadth of the branches (graphr(create_tree(50, width = 2)) + ggtitle("Tree graph")) (graphr(create_tree(50, width = 2, directed = TRUE)) + ggtitle("Tree out")) (graphr(create_tree(50, width = 2, directed = TRUE), "tree") + ggtitle("Tree layout"))
Try varying the width argument to see the result.
Lattices
r gloss("Lattices","lattice") reflect highly clustered networks
where there is a high likelihood that interaction partners also interact.
They are used to show how clustering facilitates or limits diffusion
or makes pockets of behaviour stable.
question("Why are lattices considered highly clustered?", answer("Because neighbours are likely also neighbours of each other", message = learnr::random_praise(), correct = TRUE), answer("Because all nodes are directly connected to each other", message = learnr::random_encouragement()), answer("Because there is a single component", message = learnr::random_encouragement()), answer("Because there is a single community", message = learnr::random_encouragement()), random_answer_order = TRUE, allow_retry = TRUE)
Note that create_lattice() in {manynet} works a little differently
to how it works in {igraph}.
In {igraph} the number or vector passed to the function indicates
the length of each dimension.
So c(50) would be a one-dimensional lattice,
essentially a chain of 50 nodes connected to their neighbours.
c(50,50) would be a two-dimensional lattice,
of 50 nodes long and 50 nodes wide.
c(50,50,50) would be a three-dimensional lattice,
of 50 nodes long, 50 nodes wide, and 50 nodes deep, etc.
But this doesn't help us when we want to see what a lattice representation
with the same order (number of nodes) as a given network would be.
For example, perhaps we just want to know what a lattice with 50 nodes
would look like.
So {manynet} instead tries to find the most even or balanced
two-dimensional representation with a given number of nodes.
Graph two lattices, one with 50 nodes, and another with half the number of nodes.
(graphr(create_lattice(50)) + ggtitle("One-mode lattice graph")) (graphr(create_lattice(50/2)) + ggtitle("Smaller lattice graph"))
Rings
This creates a graph where each node has two separate neighbours which creates a ring graph. Graph three ring networks:
- one with 50 nodes
- one with 50 nodes where they are connected to neighbours two steps away, on a "circle" layout
- the same as above, but on a "stress" layout
(graphr(create_ring(50)) + ggtitle("Ring graph", subtitle = "Starring Naomi Watts")) # width argument specifies the width of the ring (graphr(create_ring(50, width = 2), "circle") + ggtitle("The Ring Two", subtitle = "No different?")) (graphr(create_ring(50, width = 2), "stress") + ggtitle("The Ring Two v2.0"))
Generating networks
Next we are going to take a look at some probabilistic graphs.
These involve some random element, perhaps in addition to specific rules,
to stochastically 'generate' networks of certain types of topologies.
As such, we'll be using the generate_*() group of functions from {manynet}.
Random graphs
An Erdös-Renyi graph is simply a random graph. You will need to specify the probability of a tie in addition to the number of nodes. An Erdos-Renyi graph on the vertex set $V$ is a random graph which connects each pair of nodes ${i,j}$ with probability $p$, independent. Note that for a “sparse” ER graphs, $p$ must decrease as $N$ goes up. Generate three random networks of 50 nodes and a density of 0.08:
(graphr(generate_random(50, 0.08)) + ggtitle("Random 1 graph")) (graphr(generate_random(50, 0.08)) + ggtitle("Random 2 graph")) (graphr(generate_random(50, 0.08)) + ggtitle("Random 3 graph"))
Keep going if you like... it will be a little different every time. Note that you can also pass the second argument an integer, in which case the function will interpret that as the number of ties/edges rather than the probability that a tie is present. Try generating a random graph with 200 edges/ties now:
(erdren4 <- graphr(generate_random(50, 200)) + ggtitle("Random 1 graph"))
Small-world graphs
Remember the ring graph from above? What if we rewire (change) some of the edges at a certain probability? This is how small-world networks are generated. Graph three small-world networks, all with 50 nodes and a rewiring probability of 0.025.
(graphr(generate_smallworld(50, 0.025)) + ggtitle("Smallworld 1 graph")) (graphr(generate_smallworld(50, 0.025)) + ggtitle("Smallworld 2 graph")) (graphr(generate_smallworld(50, 0.025)) + ggtitle("Smallworld 3 graph"))
With on average 2.5 ties randomly rewired, does the structure look different? This is a small-world network, where clustering/transitivity remains high but path lengths are much lower than they would otherwise be. Remember that in a small-world network, the shortest-path distance between nodes increases sufficiently slowly as a function of the number of nodes in the network. You can also call these networks a Watts–Strogatz toy network. If you want to review this, go back to the reading by Watts (2004).
There is also such a thing as a network's small-world coefficient. See the help page for more details, but with the default equation ('omega'), the coefficient typically ranges between 0 and 1, where 1 is as close to a small-world as possible. Try it now on a small-world generated network, but with a rewiring probability of 0.25:
net_smallworld(generate_smallworld(50, 0.25))
Scale-free graphs
There is another famous model in network science: the scale-free model. Remember: "In many real-world networks, the distribution of the number of network neighbours the degree distribution is typically right-skewed with a "heavy tail". A majority of the nodes have less-than-average degree and a small fraction of hubs are many times better connected than average (2004, p. 250).
The following generates a scale-free graph according to the Barabasi-Albert (BA) model that rests upon the mechanism of preferential attachment. More on this in the Watts paper (2005, p.51) and Merton (1968). The BA model rests on two mechanisms: population growth and preferential attachment. Population growth: real networks grow in time as new members join the population. Preferential/cumulative attachment means that newly arriving nodes will tend to connect to already well-connected nodes rather than poorly connected ones.
Generate and graph three scale-free networks, with alpha parameters of 0.5, 1, and 1.5.
(graphr(generate_scalefree(50, 0.5)) + ggtitle("Scalefree 1 graph", subtitle = "Power = .5")) (graphr(generate_scalefree(50, 1)) + ggtitle("Scalefree 2 graph", subtitle = "Power = 1")) (graphr(generate_scalefree(50, 1.5)) + ggtitle("Scalefree 3 graph", subtitle = "Power = 1.5"))
You can also the degree to which a network has a degree distribution that fits a power-law distribution. With an alpha/power-law exponent between 2 and 3, one generally cannot reject the hypothesis that the observed data comes from a power-law distribution.
net_scalefree(generate_scalefree(50, 2))
Core-Periphery
Core-periphery graphs
Lastly, we'll take a look at some core-periphery graphs. The most common definition of a core-periphery network is one in which the network can be partitioned into two groups such that one group of nodes (the core) has dense interactions among themselves, moderately dense interactions with the second group, and the second group (the periphery) has sparse interactions among themselves.
question("Can a single network have both a community structure and a core-periphery structure?", answer("No", message = learnr::random_encouragement()), answer("Yes", message = "That's right. For example, the core and periphery might represent two or more communities.", correct = TRUE), random_answer_order = TRUE, allow_retry = TRUE)
We can visualise extreme versions of such a network
using the create_core() function.
Graph a core-periphery network of 50 nodes
(which, unless a core-periphery membership assignment is given,
will be split evenly between core and periphery partitions).
(graphr(create_core(50)) + ggtitle("Core"))
Core-periphery assignment
Let's consider identifying the core and peripheral nodes in a network.
Let's use the ison_lawfirm dataset from {manynet}.
This dataset involves relations between partners in a corporate law firm in New England.
First of all, graph the data and see whether you can guess which nodes
might be part of the core and which are part of the periphery.
Color the nodes by Gender, Office, Practice, and School.
Any you might think correlate with core status?
lawfirm <- ison_lawfirm |> to_uniplex("friends") |> to_undirected()
lawfirm <- ison_lawfirm |> to_uniplex("friends") |> to_undirected() graphr(lawfirm, node_color = "school", edge_color = "darkgray") graphr(lawfirm, node_color = "gender", edge_color = "darkgray") graphr(lawfirm, node_color = "office", edge_color = "darkgray") graphr(lawfirm, node_color = "practice", edge_color = "darkgray")
Next, let's assign nodes to the core and periphery blocks
using the node_is_core() function.
It works pretty straightforwardly.
By default it runs down the rank order of nodes by their degree,
at each step working out whether including the next highest degree node
in the core will maximise the core-periphery structure of the network.
lawfirm %>% mutate(nc = node_is_core()) %>% graphr(node_color = "nc", edge_color = "gray")
This graph suggests that there is a core and a periphery. There might even be two cores here, one on the left and one on the right.
But is it really all that much of a core-periphery structure?
We can establish how correlated our network is compared to
a core-periphery model of the same dimension using net_core().
net_core(lawfirm, node_is_core(lawfirm))
question("What can we say about this correlation.", answer("It is a perfect negative relationship", message = learnr::random_encouragement()), answer("It is fairly strong", message = learnr::random_encouragement()), answer("It is positive", message = learnr::random_encouragement()), answer("There is absolutely no correlation", message = learnr::random_encouragement()), answer("None of the above", correct = TRUE, message = learnr::random_praise()), allow_retry = TRUE )
Note that node_is_core() also includes a method that descends through
the rank order of nodes' eigenvector centralities instead of degree centralities.
Why might that not be such a good choice here?
Now let's see whether our core-periphery membership vector correlates with any of the three categorical attributes we looked at before. Since we're doing this on categorical variables, we'll use the Chi-squared test in base R. Take a look and see whether there is a statistically significant association between gender and core (or periphery) status.
chisq.test(as.factor(node_is_core(lawfirm)), as.factor(node_attribute(lawfirm, "gender")))
chisq.test(as.factor(node_is_core(lawfirm)), as.factor(node_attribute(lawfirm, "gender"))) chisq.test(as.factor(node_is_core(lawfirm)), as.factor(node_attribute(lawfirm, "office"))) chisq.test(as.factor(node_is_core(lawfirm)), as.factor(node_attribute(lawfirm, "school"))) chisq.test(as.factor(node_is_core(lawfirm)), as.factor(node_attribute(lawfirm, "practice")))
question("There a statistically significant association between the core assignment and...", answer("gender.", message = learnr::random_encouragement()), answer("office.", message = learnr::random_encouragement()), answer("school.", message = learnr::random_encouragement()), answer("practice.", message = learnr::random_encouragement()), answer("none of the above variables.", correct = TRUE, message = "That's right. The p-value for office is close, but no cigar."), allow_retry = TRUE )
Coreness
An alternative route is to identify 'core' nodes
depending on their k-coreness.
In {manynet}, we can return nodes k-coreness
with node_coreness() instead of
the node_is_core() used for core-periphery.
lawfirm %>% mutate(ncn = node_coreness()) %>% graphr(node_color = "ncn")
question("Which has more than two classes/groups.", answer("node_coreness()", correct = TRUE, message = learnr::random_praise()), answer("node_is_core()", message = learnr::random_encouragement()), random_answer_order = TRUE, allow_retry = TRUE )
question("Select the correct definitions:", answer("The k-core of a network is a maximal subgraph in which each vertex has at least degree k.", correct = TRUE, message = learnr::random_praise()), answer("The coreness of a node is k if it belongs to the k-core but not to the (k+1)-core.", correct = TRUE), answer("The coreness of a node is equal to its degree.", message = learnr::random_encouragement()), random_answer_order = TRUE, allow_retry = TRUE )
Resilience
How cohesive is the network?
When investigating a network's resilience,
we might think of whether the network will remain connected despite some nodes or ties dropping out.
Let's explore how resilient a (core) network of adolescents (ison_adolescents) might be.
First, we might be interested in whether the network is connected at all.
net_connectedness(ison_adolescents)
This measure gets at the proportion of dyads that can reach each other in the network. In this case, the proportion is 1, i.e. all nodes can reach every other node. Another way to get at this would be to see how many components there are in the network.
question("But counting the number of components instead of connectedness can overemphasise:", answer("Isolates", correct = TRUE, message = learnr::random_praise()), answer("Small components", correct = TRUE, message = learnr::random_encouragement()), answer("Density", message = learnr::random_encouragement()), random_answer_order = TRUE, allow_retry = TRUE )
A dropped tie can have severe consequences to the topology of a network if it is a bridge, say. But a dropped node can be even more consequential, as it will take any ties it has with it. Find out how many dropped nodes it would take to (further) fragment the network.
net_cohesion(ison_adolescents)
question("The result of this function represents...", answer("the minimum number of nodes necessary to remove from the network to increase the number of components.", correct = TRUE, message = learnr::random_praise()), answer("the number of strong components in the network.", message = learnr::random_encouragement()), answer("the minimum number of ties necessary to remove from the network to increase the number of components.", message = "This is actually the definition of `node_adhesion()`."), random_answer_order = TRUE, allow_retry = TRUE )
question("The higher the minimum number of nodes to remove...", answer("the more resilient is the network.", correct = TRUE, message = learnr::random_praise()), answer("the less resilient the network.", message = learnr::random_encouragement()), random_answer_order = TRUE, allow_retry = TRUE )
Identifying cutpoints
But which are these nodes? Is there more than one?
Nodes that endanger fragmentation of the network are called r gloss("cutpoints","cutpoint").
Find and use a function to identify which, if any, of the nodes in the ison_adolescents
network are cutpoints.
node_is_cutpoint(ison_adolescents)
Ok, so this results in a vector identifying which nodes are cutpoints (TRUE) or not (FALSE). Somewhat more useful though would be to highlight these nodes on the network. Can you add a node attribute that highlights which nodes are cutpoints?
ison_adolescents |> mutate(cut = node_is_cutpoint(ison_adolescents)) |> graphr(node_color = "cut")
Identifying bridges
Let's do something similar now, but with respect to ties rather than nodes.
Here we are interested in identifying which ties are r gloss("bridges","bridge").
net_adhesion(ison_adolescents) ison_adolescents |> mutate_ties(cut = tie_is_bridge(ison_adolescents)) |> graphr(edge_color = "cut")
We could also investigate the opposite of a bridge, the degree to which ties are deeply embedded in triangles. This is called (rather confusingly) tie cohesion.
ison_adolescents |> mutate_ties(coh = tie_cohesion(ison_adolescents)) |> graphr(edge_size = "coh")
Where would you target your efforts if you wanted to fragment this network?
Free play
Glossary
Here are some of the terms that we have covered in this module:
r print_glossary()
Try the manynet package in your browser
Any scripts or data that you put into this service are public.
R Package Documentation
Browse R Packages
We want your feedback!
Note that we can't provide technical support on individual packages. You should contact the package authors for that.
Embedding an R snippet on your website
Add the following code to your website.
For more information on customizing the embed code, read Embedding Snippets.