Nothing
README.md
In personograph: Pictographic Representation of Treatment Effects
Code on Github.
Personograph
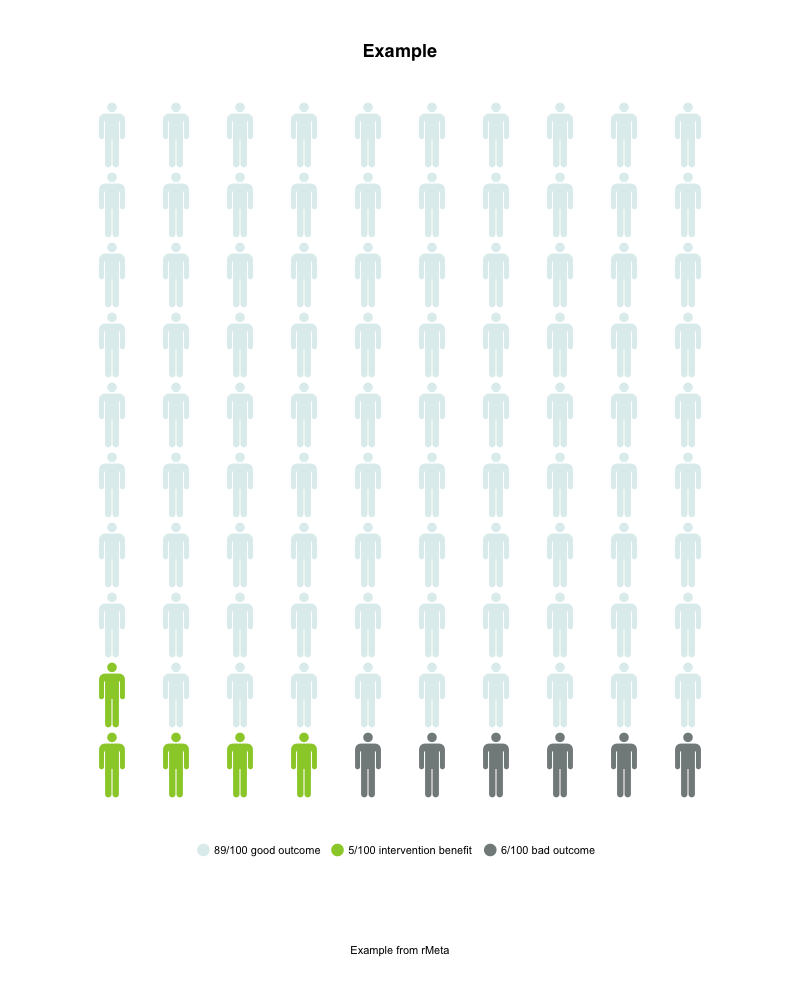
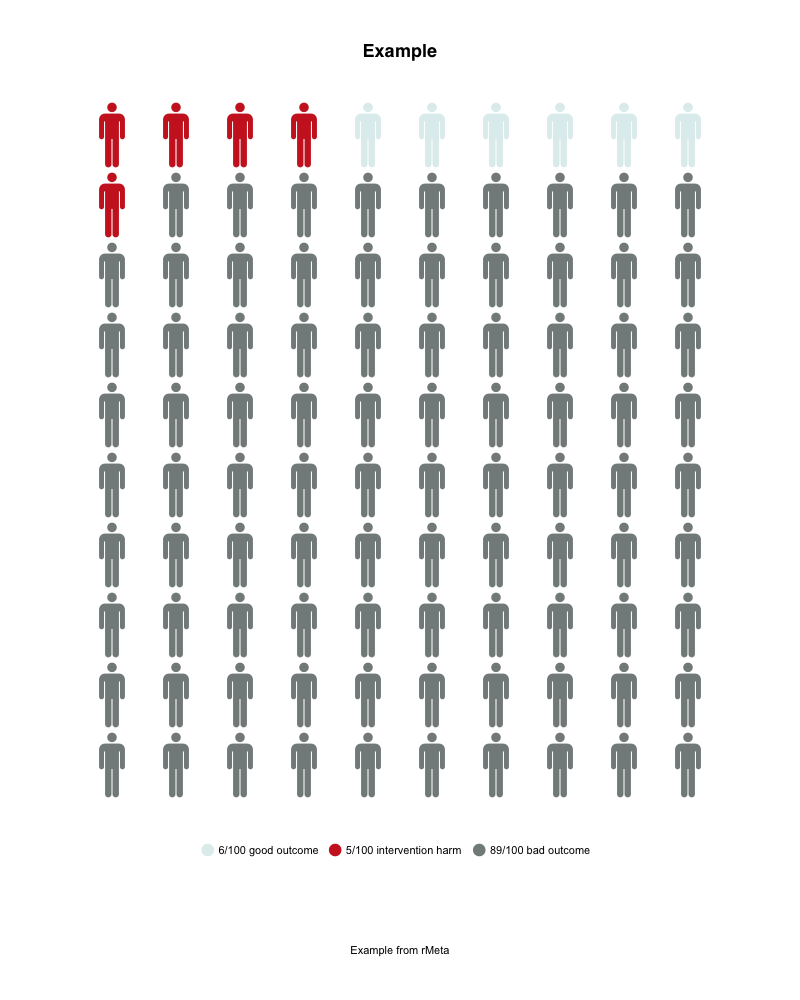
A personograph (Kuiper-Marshall plot) is a pictographic
representation of relative harm and benefit from an intervention. It
is similar to
Visual Rx (Cates Plots).
Each icon on the grid is colored to indicate whether that percentage
of people is harmed by the intervention, would benefit from the
intervention, has good outcome regardless of intervention, or bad
outcome regardless of intervention. This terminology is similar to
that of
Uplift Modelling.
The plot function personograph is implemented in such a way that
it's easy to just pass a named list of percentages, colors, and an
icon. Making it potentially useful for other use cases as well.
Installation
Latest release on CRAN
Latest development version
install.packages("devtools")
devtools::install_github("joelkuiper/personograph")
Development
Install devtools and roxygen2.
To generate documentation run document() in the package folder after loading devtools with library(devtools).
The documentation is automatically generated from the comments in the source code.
See the Roxygen documentation for details.
To convert the documentation to PDF use R CMD Rd2pdf <package>.
To build
R CMD build . in the personograph folder.
Then do R CMD CHECK <the generated.tar.gz> and/or R CMD CHECK --as-cran <the generated.tar.gz>.
Funding & Acknowledgments
This software was commissioned and sponsored by Doctor Evidence.
The Doctor Evidence mission is to improve clinical outcomes by finding and delivering medical evidence to healthcare professionals, medical associations, policy makers and manufacturers through revolutionary solutions that enable anyone to make informed decisions and policies using medical data that is more accessible, relevant and readable.
Try the personograph package in your browser
Any scripts or data that you put into this service are public.
personograph documentation built on May 1, 2019, 9:54 p.m.
R Package Documentation
Browse R Packages
We want your feedback!
Note that we can't provide technical support on individual packages. You should contact the package authors for that.
Code on Github.
Personograph
A personograph (Kuiper-Marshall plot) is a pictographic representation of relative harm and benefit from an intervention. It is similar to Visual Rx (Cates Plots). Each icon on the grid is colored to indicate whether that percentage of people is harmed by the intervention, would benefit from the intervention, has good outcome regardless of intervention, or bad outcome regardless of intervention. This terminology is similar to that of Uplift Modelling.
The plot function personograph is implemented in such a way that
it's easy to just pass a named list of percentages, colors, and an
icon. Making it potentially useful for other use cases as well.
Installation
Latest release on CRAN
Latest development version
install.packages("devtools")
devtools::install_github("joelkuiper/personograph")
Development
Install devtools and roxygen2.
To generate documentation run document() in the package folder after loading devtools with library(devtools).
The documentation is automatically generated from the comments in the source code.
See the Roxygen documentation for details.
To convert the documentation to PDF use R CMD Rd2pdf <package>.
To build
R CMD build . in the personograph folder.
Then do R CMD CHECK <the generated.tar.gz> and/or R CMD CHECK --as-cran <the generated.tar.gz>.
Funding & Acknowledgments
This software was commissioned and sponsored by Doctor Evidence. The Doctor Evidence mission is to improve clinical outcomes by finding and delivering medical evidence to healthcare professionals, medical associations, policy makers and manufacturers through revolutionary solutions that enable anyone to make informed decisions and policies using medical data that is more accessible, relevant and readable.
Try the personograph package in your browser
Any scripts or data that you put into this service are public.
R Package Documentation
Browse R Packages
We want your feedback!
Note that we can't provide technical support on individual packages. You should contact the package authors for that.
Embedding an R snippet on your website
Add the following code to your website.
For more information on customizing the embed code, read Embedding Snippets.