Nothing
README.md
In scatterbar: Scattered Stacked Bar Chart Plots
scatterbar
scatterbar is an open-source R package for displaying proportional data across spatially resolved contexts. This is the scatterbar R documentation
website. Questions, suggestions, or problems should be submitted as
GitHub issues.

Overview
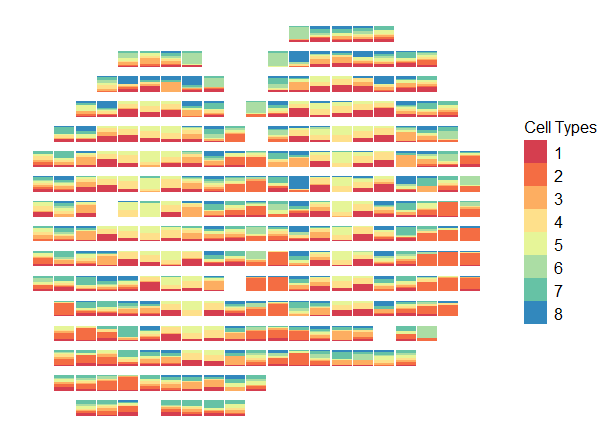
By combining the concepts of scatter plots and stacked bar charts,
scatterbar allows users to visualize variations in proportional data
data and compare across different spatial locations.
Installation
To install scatterbarfrom GitHub, we recommend using remotes:
require(remotes)
remotes::install_github('JEFworks-Lab/scatterbar')
Tutorials
- Customizing
Scatterbar
- Getting Started With
Scatterbar
- Using Scatterbar With Visium Files
- Visualizing Multiple Datasets
- Flipping Scatterbar Oreintations
Citation
Our preprint describing scatterbar is available on bioRxiv:
Try the scatterbar package in your browser
Any scripts or data that you put into this service are public.
scatterbar documentation built on April 4, 2025, 5:23 a.m.
R Package Documentation
Browse R Packages
We want your feedback!
Note that we can't provide technical support on individual packages. You should contact the package authors for that.
scatterbar
scatterbar is an open-source R package for displaying proportional data across spatially resolved contexts. This is the scatterbar R documentation
website. Questions, suggestions, or problems should be submitted as
GitHub issues.
![]()
Overview
By combining the concepts of scatter plots and stacked bar charts,
scatterbar allows users to visualize variations in proportional data
data and compare across different spatial locations.
Installation
To install scatterbarfrom GitHub, we recommend using remotes:
require(remotes)
remotes::install_github('JEFworks-Lab/scatterbar')
Tutorials
- Customizing Scatterbar
- Getting Started With Scatterbar
- Using Scatterbar With Visium Files
- Visualizing Multiple Datasets
- Flipping Scatterbar Oreintations
Citation
Our preprint describing scatterbar is available on bioRxiv:
Try the scatterbar package in your browser
Any scripts or data that you put into this service are public.
R Package Documentation
Browse R Packages
We want your feedback!
Note that we can't provide technical support on individual packages. You should contact the package authors for that.
Embedding an R snippet on your website
Add the following code to your website.
For more information on customizing the embed code, read Embedding Snippets.