Nothing
Animating Tracking Data
In sportyR: Plot Scaled 'ggplot' Representations of Sports Playing Surfaces
knitr::opts_chunk$set(
  collapse = TRUE,
  comment = "#>",
  fig.path = "animating-tracking-data-",
  out.width = "100%",
  dpi = 600
)
options(rmarkdown.html_vignette.check_title = FALSE)
For the following vignette, you'll need the sportyR, ggplot2, and gganimate packages loaded into your workspace.
library(sportyR)
library(ggplot2)
library(gganimate)
If this is your first experience with plotting tracking data, please check out the plotting-tracking-data vignette. Otherwise, let's see how to make GIFs with sportyR and gganimate.
The Data
For this example, we'll use a play from Week 15 of the 2018 NFL season between the Chicago Bears and Green Bay Packers. Data made available for the Big Data Bowl 2021 Kaggle competition.
# Load the play data
example_nfl_play <- data.table::fread(
  glue::glue(
    "https://raw.githubusercontent.com/sportsdataverse/sportyR/",
    "main/data-raw/example-pbp-data.csv"
  )
)

# Convert to data frame
example_nfl_play <- as.data.frame(example_nfl_play)
To keep things easy, let's specify the colors for each team's dots on the resulting GIF. We'll make the Bears [orange]{style="color: #c83803"} and the Packers [yellow]{style="color: #ffb612"}. The football will also need a dot to be seen; let's make it [brown]{style="color: #624a2e"}.
# Prep data for plotting
example_nfl_play[example_nfl_play["team"] == "home", "color"] <- "#c83803"
example_nfl_play[example_nfl_play["team"] == "away", "color"] <- "#ffb612"
example_nfl_play[example_nfl_play["team"] == "football", "color"] <- "#624a2e"
First, let's draw an NFL field via geom_football("nfl"). We'll adjust the origin to be in the lower left corner of the field, as per the notes on the coordinate system on the Kaggle page describing the data.
# Create the field
nfl_field <- geom_football("nfl", x_trans = 60, y_trans = 26.6667)

# Display the field
nfl_field
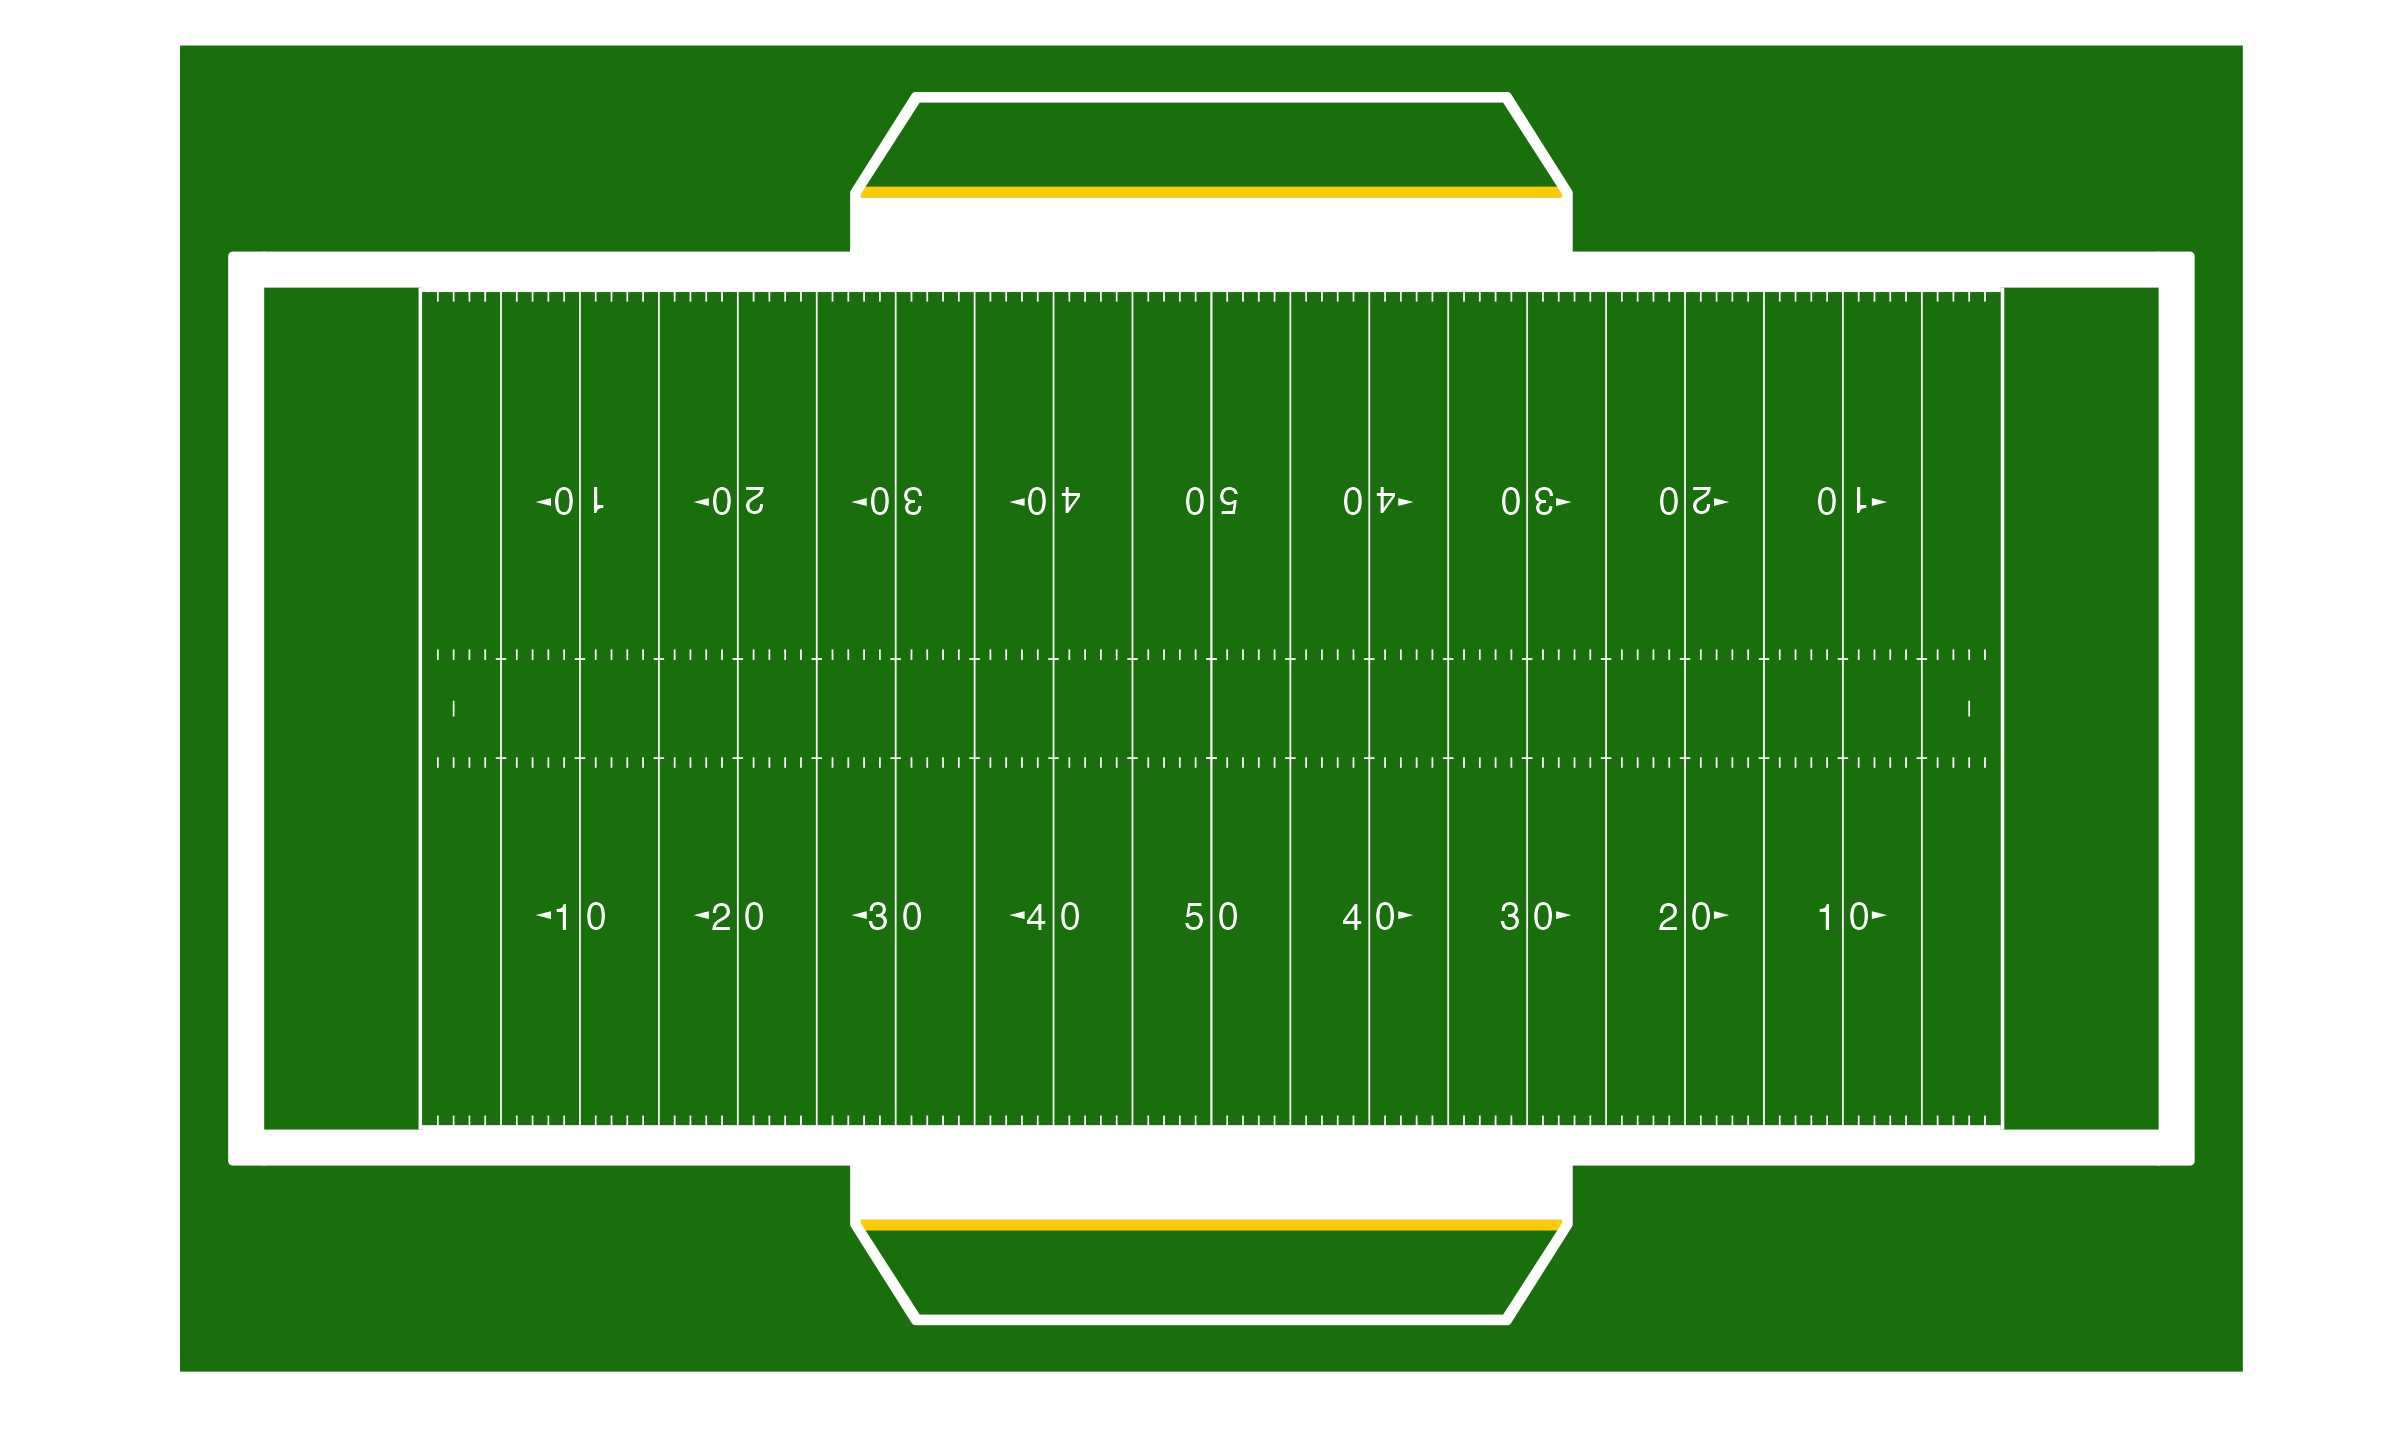 {width=75%}
Looks good! Now, let's animate using gganimate.
# Add the points on the field
play_anim <- nfl_field +
  geom_point(
    data = example_nfl_play,
    aes(x, y),
    color = example_nfl_play$color
  ) +
  transition_time(example_nfl_play$frameId)

# Show the animation
play_anim
 {width=75%}
Easy peasy. As noted on the plotting-tracking-data vignette, this too works so long as the geospatial data is provided and contains a way to identify and order the frames of the resulting GIF.
Try the sportyR package in your browser
Any scripts or data that you put into this service are public.
sportyR documentation built on May 29, 2024, 8:33 a.m.
R Package Documentation
Browse R Packages
We want your feedback!
Note that we can't provide technical support on individual packages. You should contact the package authors for that.
knitr::opts_chunk$set( collapse = TRUE, comment = "#>", fig.path = "animating-tracking-data-", out.width = "100%", dpi = 600 ) options(rmarkdown.html_vignette.check_title = FALSE)
For the following vignette, you'll need the sportyR, ggplot2, and gganimate packages loaded into your workspace.
library(sportyR) library(ggplot2) library(gganimate)
If this is your first experience with plotting tracking data, please check out the plotting-tracking-data vignette. Otherwise, let's see how to make GIFs with sportyR and gganimate.
The Data
For this example, we'll use a play from Week 15 of the 2018 NFL season between the Chicago Bears and Green Bay Packers. Data made available for the Big Data Bowl 2021 Kaggle competition.
# Load the play data example_nfl_play <- data.table::fread( glue::glue( "https://raw.githubusercontent.com/sportsdataverse/sportyR/", "main/data-raw/example-pbp-data.csv" ) ) # Convert to data frame example_nfl_play <- as.data.frame(example_nfl_play)
To keep things easy, let's specify the colors for each team's dots on the resulting GIF. We'll make the Bears [orange]{style="color: #c83803"} and the Packers [yellow]{style="color: #ffb612"}. The football will also need a dot to be seen; let's make it [brown]{style="color: #624a2e"}.
# Prep data for plotting example_nfl_play[example_nfl_play["team"] == "home", "color"] <- "#c83803" example_nfl_play[example_nfl_play["team"] == "away", "color"] <- "#ffb612" example_nfl_play[example_nfl_play["team"] == "football", "color"] <- "#624a2e"
First, let's draw an NFL field via geom_football("nfl"). We'll adjust the origin to be in the lower left corner of the field, as per the notes on the coordinate system on the Kaggle page describing the data.
# Create the field nfl_field <- geom_football("nfl", x_trans = 60, y_trans = 26.6667) # Display the field nfl_field
![]() {width=75%}
{width=75%}
Looks good! Now, let's animate using gganimate.
# Add the points on the field play_anim <- nfl_field + geom_point( data = example_nfl_play, aes(x, y), color = example_nfl_play$color ) + transition_time(example_nfl_play$frameId) # Show the animation play_anim
![]() {width=75%}
{width=75%}
Easy peasy. As noted on the plotting-tracking-data vignette, this too works so long as the geospatial data is provided and contains a way to identify and order the frames of the resulting GIF.
Try the sportyR package in your browser
Any scripts or data that you put into this service are public.
R Package Documentation
Browse R Packages
We want your feedback!
Note that we can't provide technical support on individual packages. You should contact the package authors for that.
Embedding an R snippet on your website
Add the following code to your website.
For more information on customizing the embed code, read Embedding Snippets.