Nothing
README.md
In sugarglider: Create Glyph-Maps of Spatiotemporal Data
sugarglider 

Overview
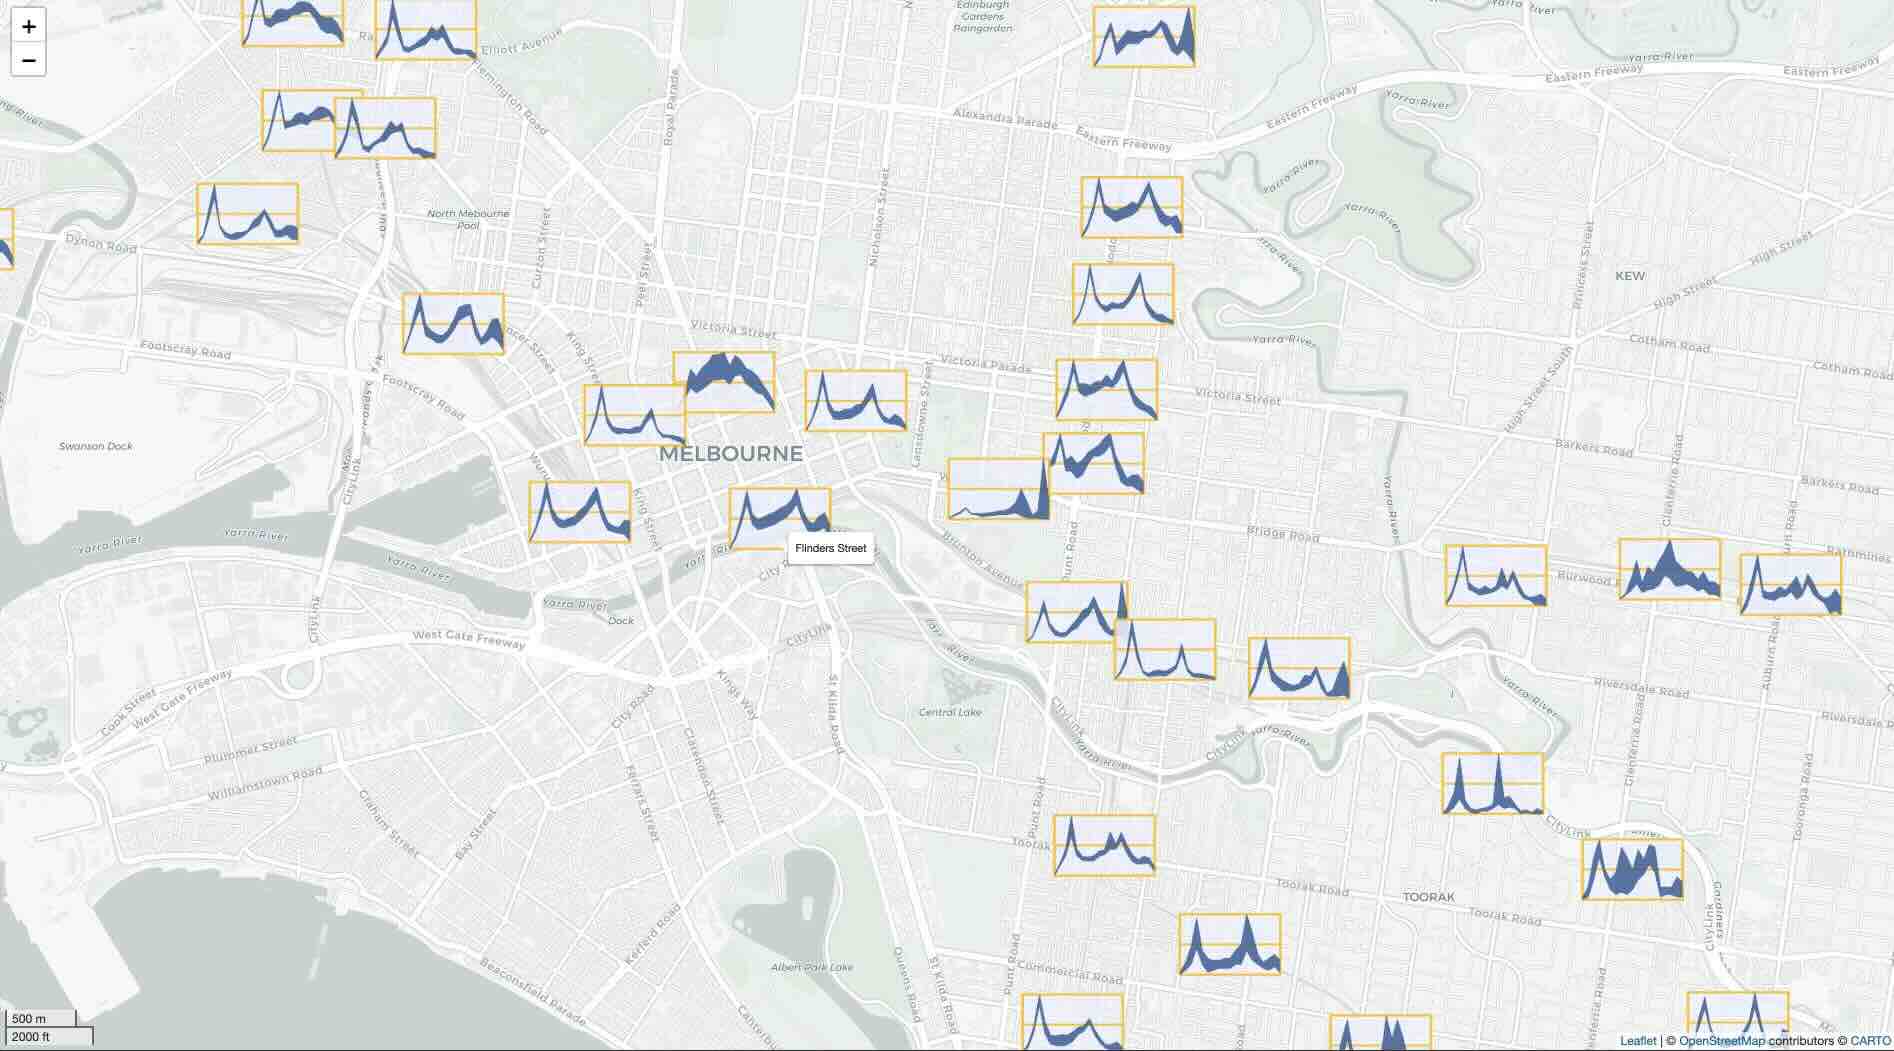
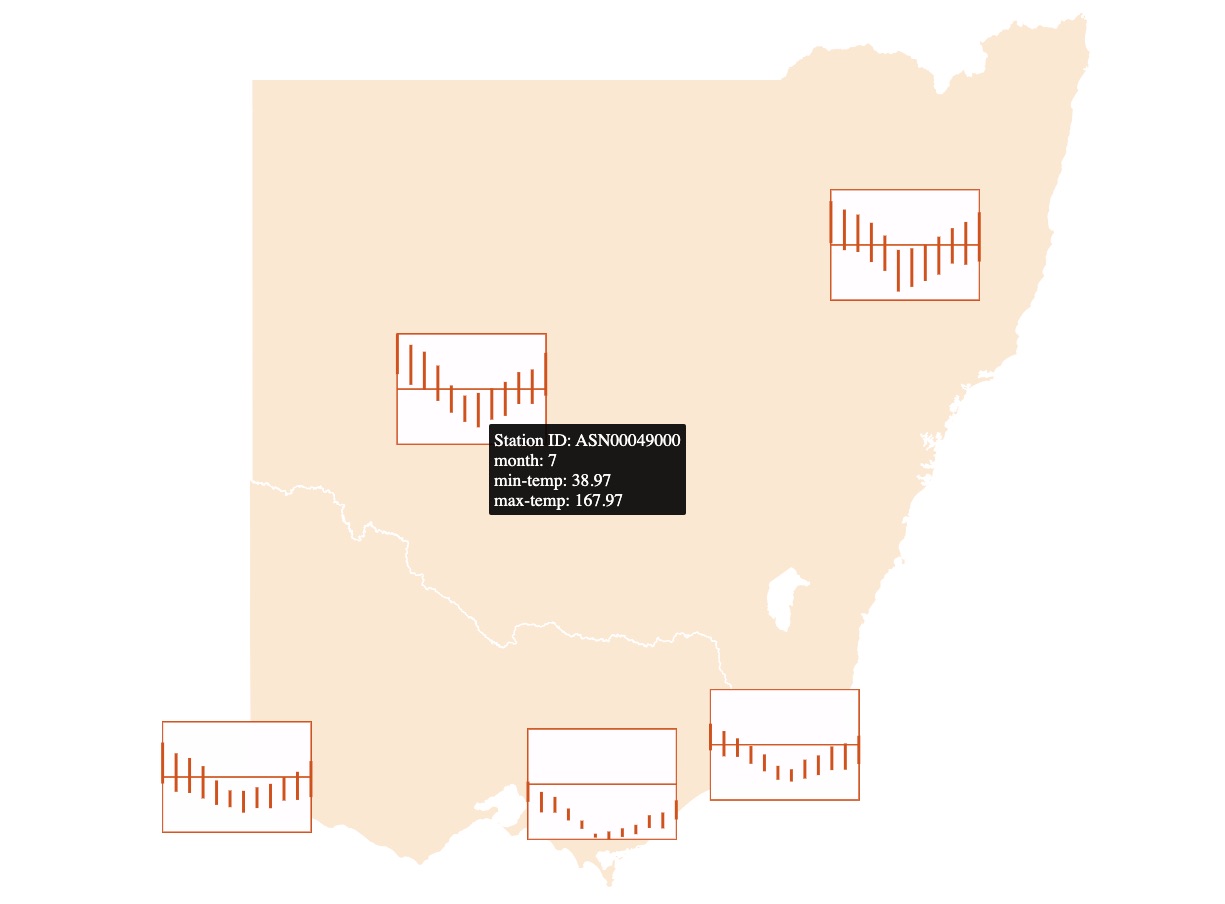
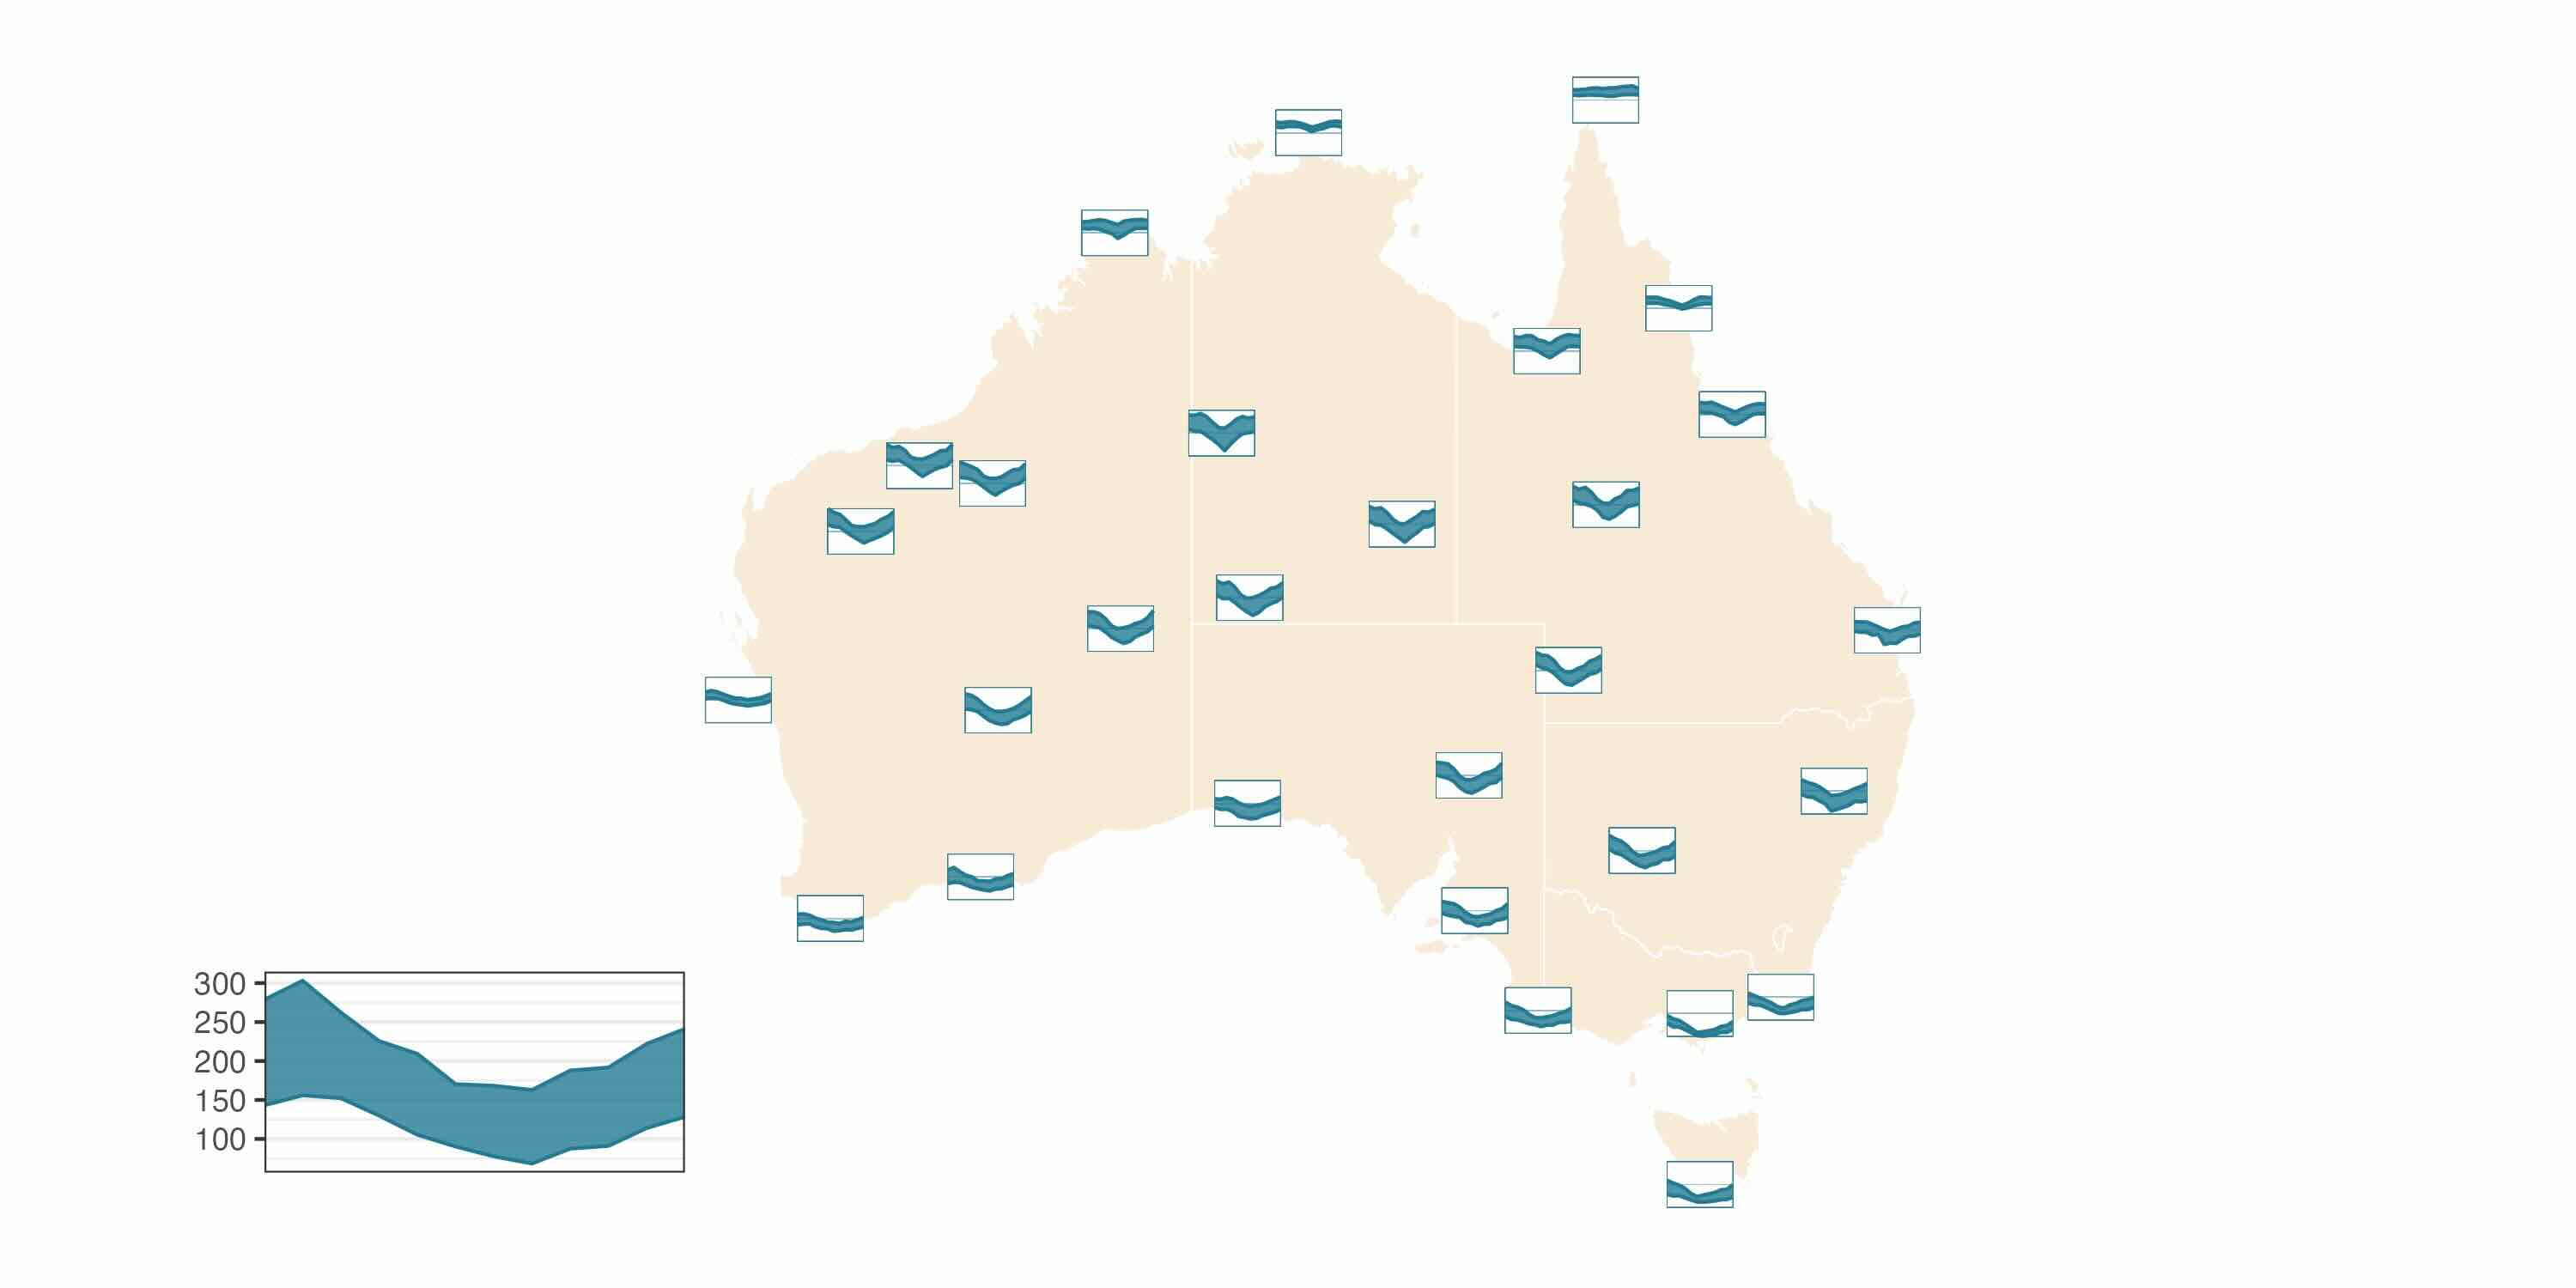
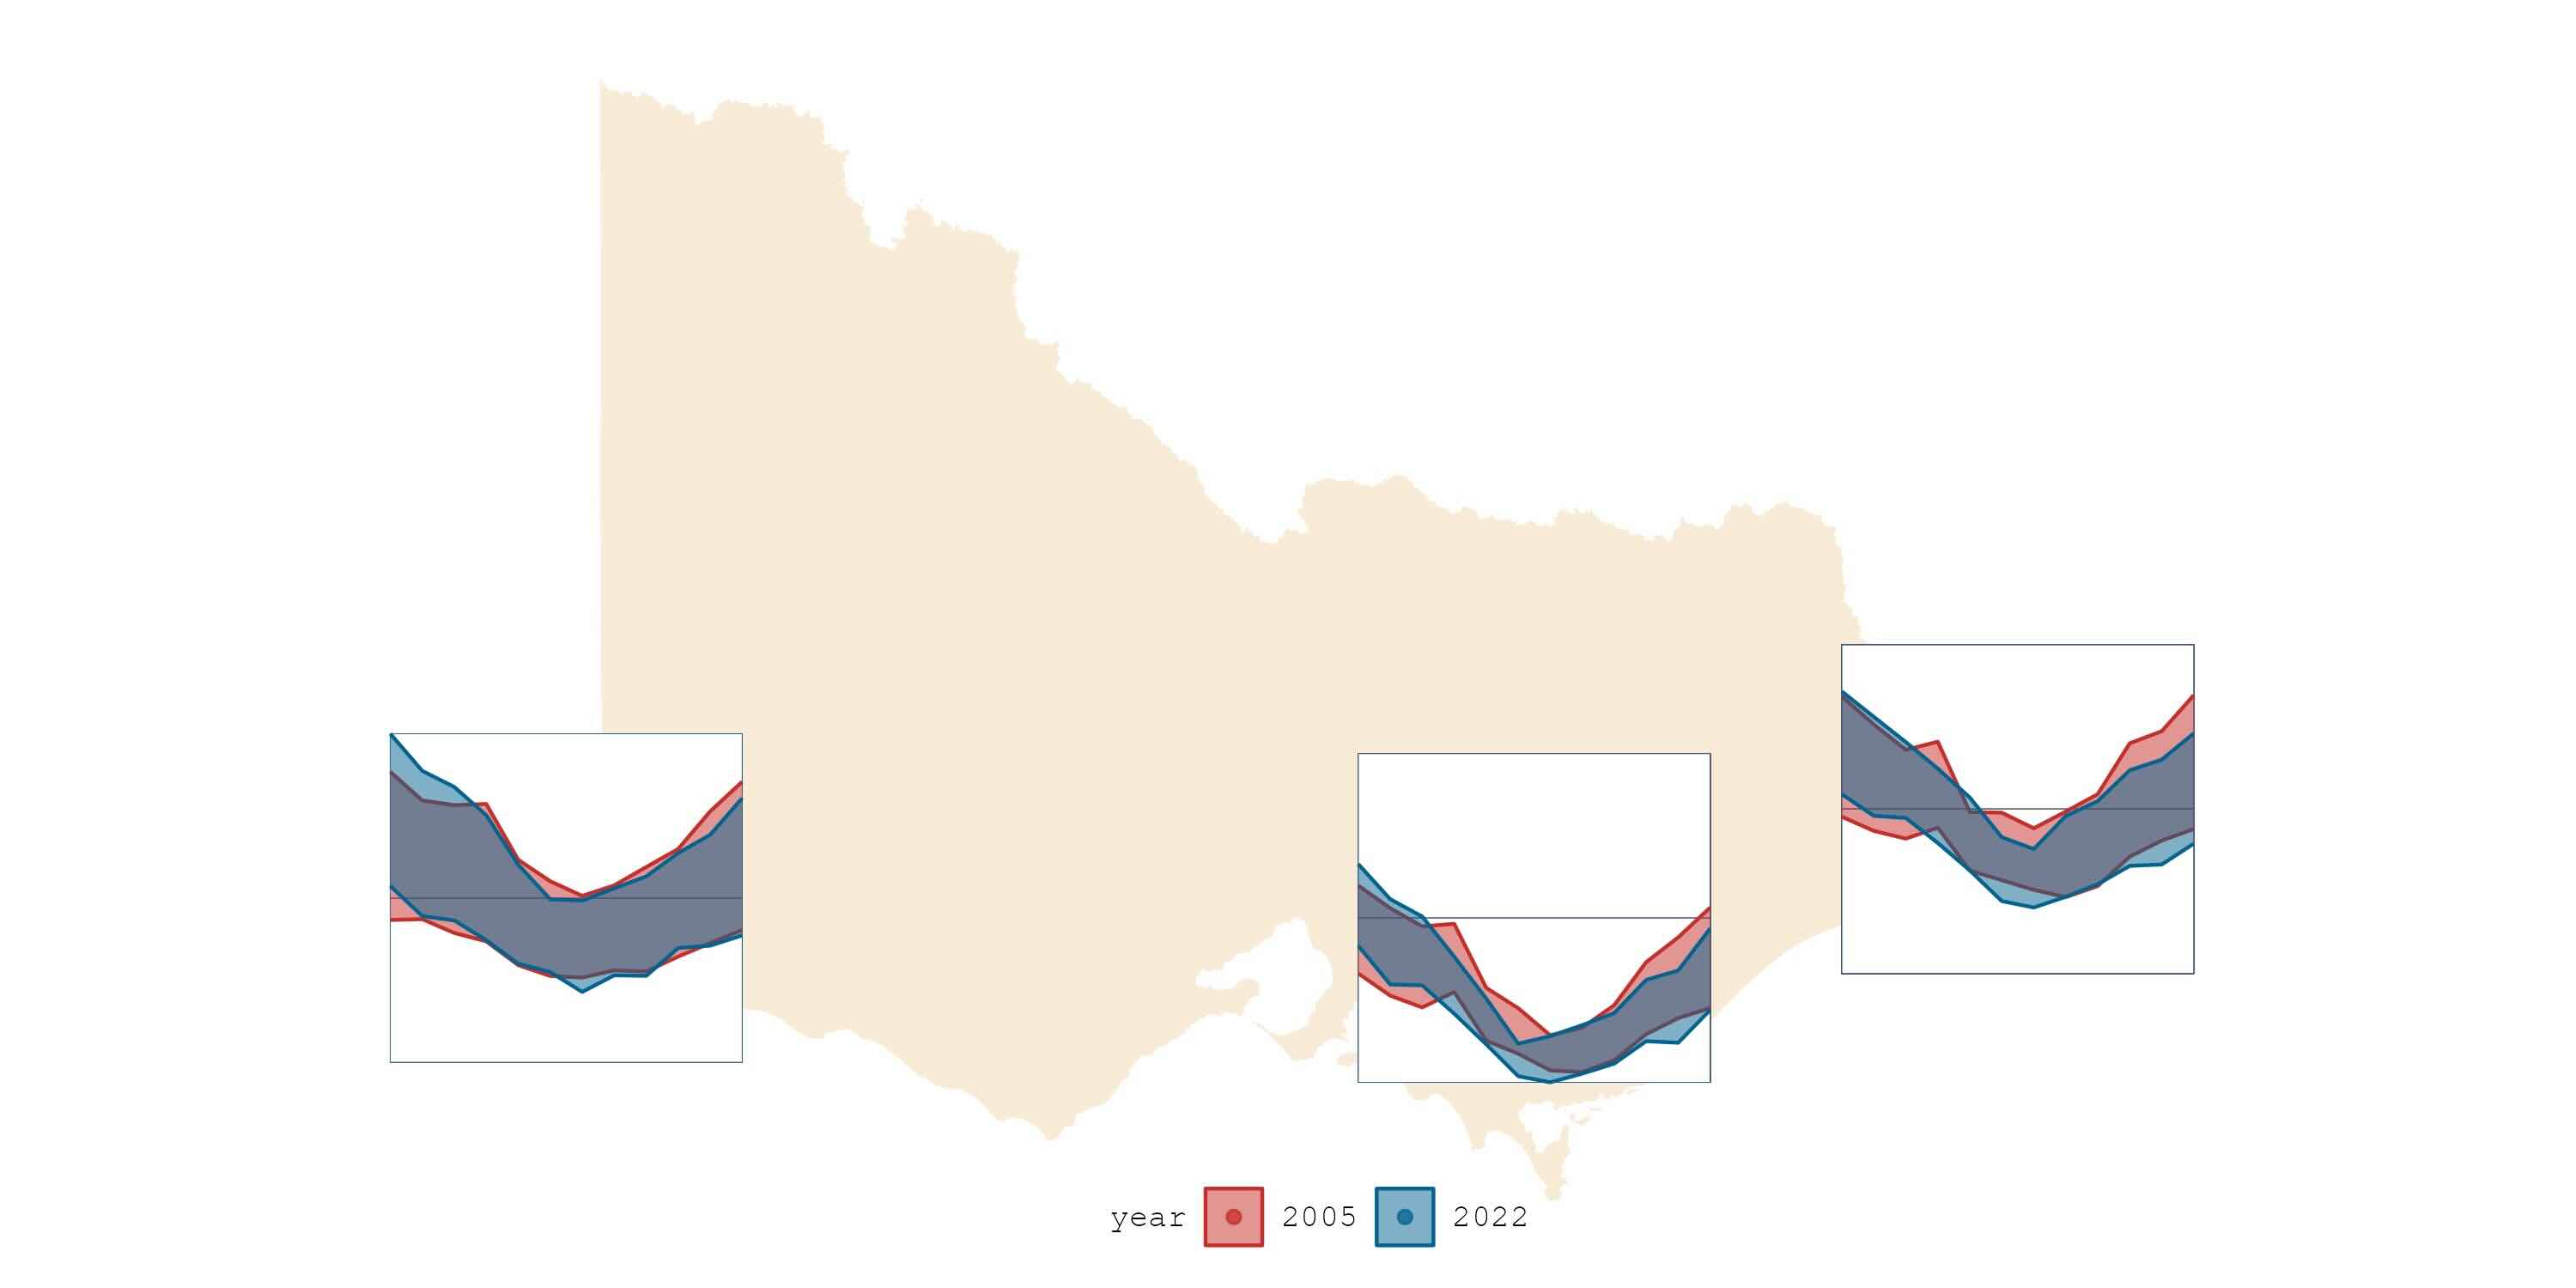
sugarglider provides ggplot2 extensions to create glyph maps that
visualize seasonal aspects of spatio-temporal data with
geom_glyph_ribbon() and geom_glyph_segment().
These functions create a ribbon or segment geometry designed to display
glyphs based on the combination of x_major and y_major. For each
x_minor value, geom_glyph_ribbon() displays a y interval defined by
ymin_minor and ymax_minor. Meanwhile, geom_glyph_segment() draws a
straight line between y_minor and yend_minor with respect to
x_minor.

Installation
# Download the development version from GitHub:
devtools::install_github("maliny12/sugarglider")
Usage
See the
examples
page to learn more about how to use sugarglider in your project.
Try the sugarglider package in your browser
Any scripts or data that you put into this service are public.
sugarglider documentation built on Oct. 24, 2024, 5:07 p.m.
R Package Documentation
Browse R Packages
We want your feedback!
Note that we can't provide technical support on individual packages. You should contact the package authors for that.
sugarglider
![]()
Overview
sugarglider provides ggplot2 extensions to create glyph maps that
visualize seasonal aspects of spatio-temporal data with
geom_glyph_ribbon() and geom_glyph_segment().
These functions create a ribbon or segment geometry designed to display
glyphs based on the combination of x_major and y_major. For each
x_minor value, geom_glyph_ribbon() displays a y interval defined by
ymin_minor and ymax_minor. Meanwhile, geom_glyph_segment() draws a
straight line between y_minor and yend_minor with respect to
x_minor.
Installation
# Download the development version from GitHub:
devtools::install_github("maliny12/sugarglider")
Usage
See the examples page to learn more about how to use sugarglider in your project.
Try the sugarglider package in your browser
Any scripts or data that you put into this service are public.
R Package Documentation
Browse R Packages
We want your feedback!
Note that we can't provide technical support on individual packages. You should contact the package authors for that.
Embedding an R snippet on your website
Add the following code to your website.
For more information on customizing the embed code, read Embedding Snippets.