Nothing
|
In switchboard: An Agile Widget Engine for Real-Time, Dynamic Visualizations
title: |

An Agile Widget Engine for Real-time, Dynamic Visualizations: the switchboard package for R [BETA]
author: 'Marc J. Lajeunesse'
date: University of South Florida, October 7th 2021 (vignette v. 0.1 for switchboard v.0.1)
output:
html_document:
smart: no
toc: yes
pdf_document:
keep_tex: yes
latex_engine: xelatex
toc: yes
word_document:
toc: yes
options(width = 800)

Purpose of the switchboard package
The switchboard package for R is an agile widget engine for creating dynamic, real-time dashboards for iterative simulations (e.g., for/while loops). It contains a growing, unsorted collection of visualization widgets rendered in a Tcl/Tk GUI--these include progress bars, counters, eavesdroppers, injectors, switches, and sliders. Below is a brief tutorial to get started on creating your own dashboards.
Updates to this vignette will be posted on our research webpage at USF.
For the source code of switchboard see: http://cran.r-project.org/web/packages/juicr/index.html or https://github.com/mjlajeunesse/switchboard.
How to cite? TBA, but for this beta version maybe:
Lajeunesse, M.J. (2021) Creating dynamic, real-time dashboards with the **switchboard** package for *R*. R package, v. 0.1.
Report a bug? Have comments or suggestions?
Please email me any bugs, comments, or suggestions and I'll try to include them in future releases: lajeunesse@usf.edu. Also try to include switchboard in the subject heading of your email. Finally, I'm open to almost anything, but expect a lag before I respond and/or new additions are added.
Video tutorials on Youtube (click on switchboard hex to watch)

Quick Monte Carlo simulation
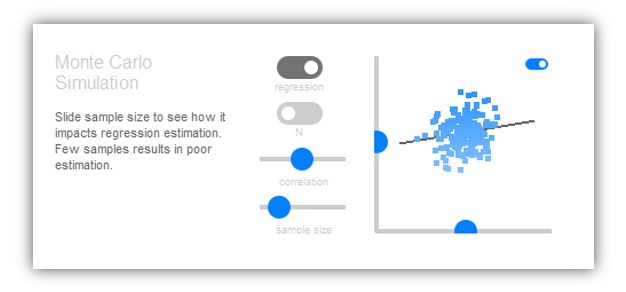
Here is how you would script a small Monte Carlo simulation exploring the effects of sample size on linear regression estimation:
library(switchboard)
library(MASS)

pop_rho <- 0
pop_X <- 0
pop_Y <- 0
pop_forget <- 400 #milliseconds
ctrl_regression <- FALSE
ctrl_N <- FALSE

for(i in 1:1e5) {

  cov_XY <- matrix(c(1, pop_rho, pop_rho, 1), nrow = 2, ncol = 2)
  sample_XY <- MASS::mvrnorm(1, mu = c(pop_X, pop_Y), Sigma = cov_XY)

  switchboard() %>%
    caption(c("Monte Carlo Simulation",
              "Slide sample size to see how it impacts regression estimation.
              Few samples results in poor estimation."),
            placeOnGrid = c(1,1), size = 2) %>%
    control_switch_pair(c("ctrl_regression", "ctrl_N"),
                        label = c("regression line", "plot N"), placeOnGrid = c(1,3)) %>%
    control_slider_pair(c("pop_rho","pop_forget"),
                        minimum = c(-1, 4), maximum = c(1, 3000),
                        label = c("correlation", "sample size"),
                        placeOnGrid = c(2,3)) %>%
    injector_2D(c(sample_XY[1], sample_XY[2]),
                inject = c("pop_X", "pop_Y"),
                minimum = c(-5,-5), maximum = c(5,5),
                plotRegression = ctrl_regression, plotSampleSize = ctrl_N, size = 2,
                forget = pop_forget, placeOnGrid = c(1,4), switch = TRUE)

}
switchboard_close()
Try the switchboard package in your browser
Any scripts or data that you put into this service are public.
switchboard documentation built on Oct. 9, 2021, 1:06 a.m.
R Package Documentation
Browse R Packages
We want your feedback!
Note that we can't provide technical support on individual packages. You should contact the package authors for that.
title: |
options(width = 800)
Purpose of the switchboard package
The switchboard package for R is an agile widget engine for creating dynamic, real-time dashboards for iterative simulations (e.g., for/while loops). It contains a growing, unsorted collection of visualization widgets rendered in a Tcl/Tk GUI--these include progress bars, counters, eavesdroppers, injectors, switches, and sliders. Below is a brief tutorial to get started on creating your own dashboards.
Updates to this vignette will be posted on our research webpage at USF.
For the source code of switchboard see: http://cran.r-project.org/web/packages/juicr/index.html or https://github.com/mjlajeunesse/switchboard.
How to cite? TBA, but for this beta version maybe:
Lajeunesse, M.J. (2021) Creating dynamic, real-time dashboards with the **switchboard** package for *R*. R package, v. 0.1.
Report a bug? Have comments or suggestions?
Please email me any bugs, comments, or suggestions and I'll try to include them in future releases: lajeunesse@usf.edu. Also try to include switchboard in the subject heading of your email. Finally, I'm open to almost anything, but expect a lag before I respond and/or new additions are added.
Video tutorials on Youtube (click on switchboard hex to watch)
Quick Monte Carlo simulation
Here is how you would script a small Monte Carlo simulation exploring the effects of sample size on linear regression estimation:
library(switchboard) library(MASS) pop_rho <- 0 pop_X <- 0 pop_Y <- 0 pop_forget <- 400 #milliseconds ctrl_regression <- FALSE ctrl_N <- FALSE for(i in 1:1e5) { cov_XY <- matrix(c(1, pop_rho, pop_rho, 1), nrow = 2, ncol = 2) sample_XY <- MASS::mvrnorm(1, mu = c(pop_X, pop_Y), Sigma = cov_XY) switchboard() %>% caption(c("Monte Carlo Simulation", "Slide sample size to see how it impacts regression estimation. Few samples results in poor estimation."), placeOnGrid = c(1,1), size = 2) %>% control_switch_pair(c("ctrl_regression", "ctrl_N"), label = c("regression line", "plot N"), placeOnGrid = c(1,3)) %>% control_slider_pair(c("pop_rho","pop_forget"), minimum = c(-1, 4), maximum = c(1, 3000), label = c("correlation", "sample size"), placeOnGrid = c(2,3)) %>% injector_2D(c(sample_XY[1], sample_XY[2]), inject = c("pop_X", "pop_Y"), minimum = c(-5,-5), maximum = c(5,5), plotRegression = ctrl_regression, plotSampleSize = ctrl_N, size = 2, forget = pop_forget, placeOnGrid = c(1,4), switch = TRUE) } switchboard_close()
Try the switchboard package in your browser
Any scripts or data that you put into this service are public.
R Package Documentation
Browse R Packages
We want your feedback!
Note that we can't provide technical support on individual packages. You should contact the package authors for that.
Embedding an R snippet on your website
Add the following code to your website.
For more information on customizing the embed code, read Embedding Snippets.