print_to_ggplot: Print to ggplot
In tfrmt: Applies Display Metadata to Analysis Results Datasets
View source: R/print_to_ggplot.R
print_to_ggplot R Documentation
Print to ggplot
Description
Print to ggplot
Usage
print_to_ggplot(tfrmt, .data, ...)
Arguments
tfrmt
tfrmt object that will dictate the structure of the ggplot object
.data
Data to style in order to make the ggplot object
...
Inputs to geom_text to modify the style of the table body
Value
a stylized ggplot object
Examples
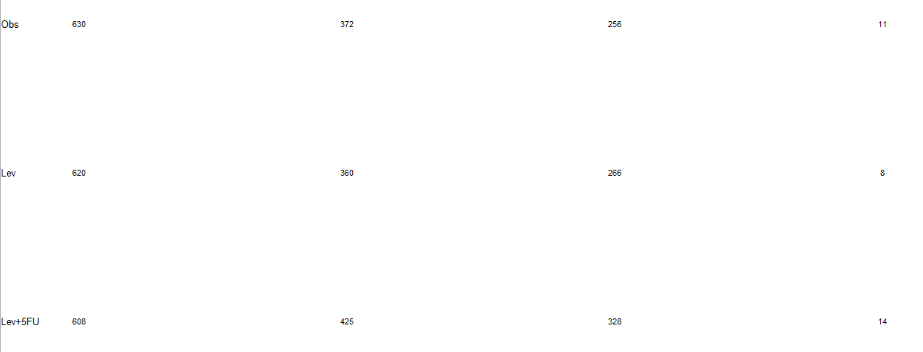
# Create data
risk<-tibble(time=c(rep(c(0,1000,2000,3000),3)),
            label=c(rep("Obs",4),rep("Lev",4),rep("Lev+5FU",4)),
            value=c(630,372,256,11,620,360,266,8,608,425,328,14),
            param=rep("n",12))

table<-tfrmt(
 label = label ,
 column = time,
 param = param,
 value = value) %>%
  print_to_ggplot(risk)

table
tfrmt documentation built on Nov. 5, 2025, 6:12 p.m.
R Package Documentation
Browse R Packages
We want your feedback!
Note that we can't provide technical support on individual packages. You should contact the package authors for that.
View source: R/print_to_ggplot.R
| print_to_ggplot | R Documentation |
Print to ggplot
Description
Print to ggplot
Usage
print_to_ggplot(tfrmt, .data, ...)
Arguments
tfrmt |
tfrmt object that will dictate the structure of the ggplot object |
.data |
Data to style in order to make the ggplot object |
... |
Inputs to geom_text to modify the style of the table body |
Value
a stylized ggplot object
Examples
# Create data
risk<-tibble(time=c(rep(c(0,1000,2000,3000),3)),
label=c(rep("Obs",4),rep("Lev",4),rep("Lev+5FU",4)),
value=c(630,372,256,11,620,360,266,8,608,425,328,14),
param=rep("n",12))
table<-tfrmt(
label = label ,
column = time,
param = param,
value = value) %>%
print_to_ggplot(risk)
table
R Package Documentation
Browse R Packages
We want your feedback!
Note that we can't provide technical support on individual packages. You should contact the package authors for that.
Embedding an R snippet on your website
Add the following code to your website.
For more information on customizing the embed code, read Embedding Snippets.