Nothing
README.md
In vizdraws: Visualize Draws from the Prior and Posterior Distributions
vizdraws
vizdraws creates interactive visualizations using draws from a prior
and posterior distributions.
Installation
install.packages('vizdraws')
The latest development version can be installed from github:
# install.packages("remotes")
remotes::install_github('ignacio82/vizdraws')
Example
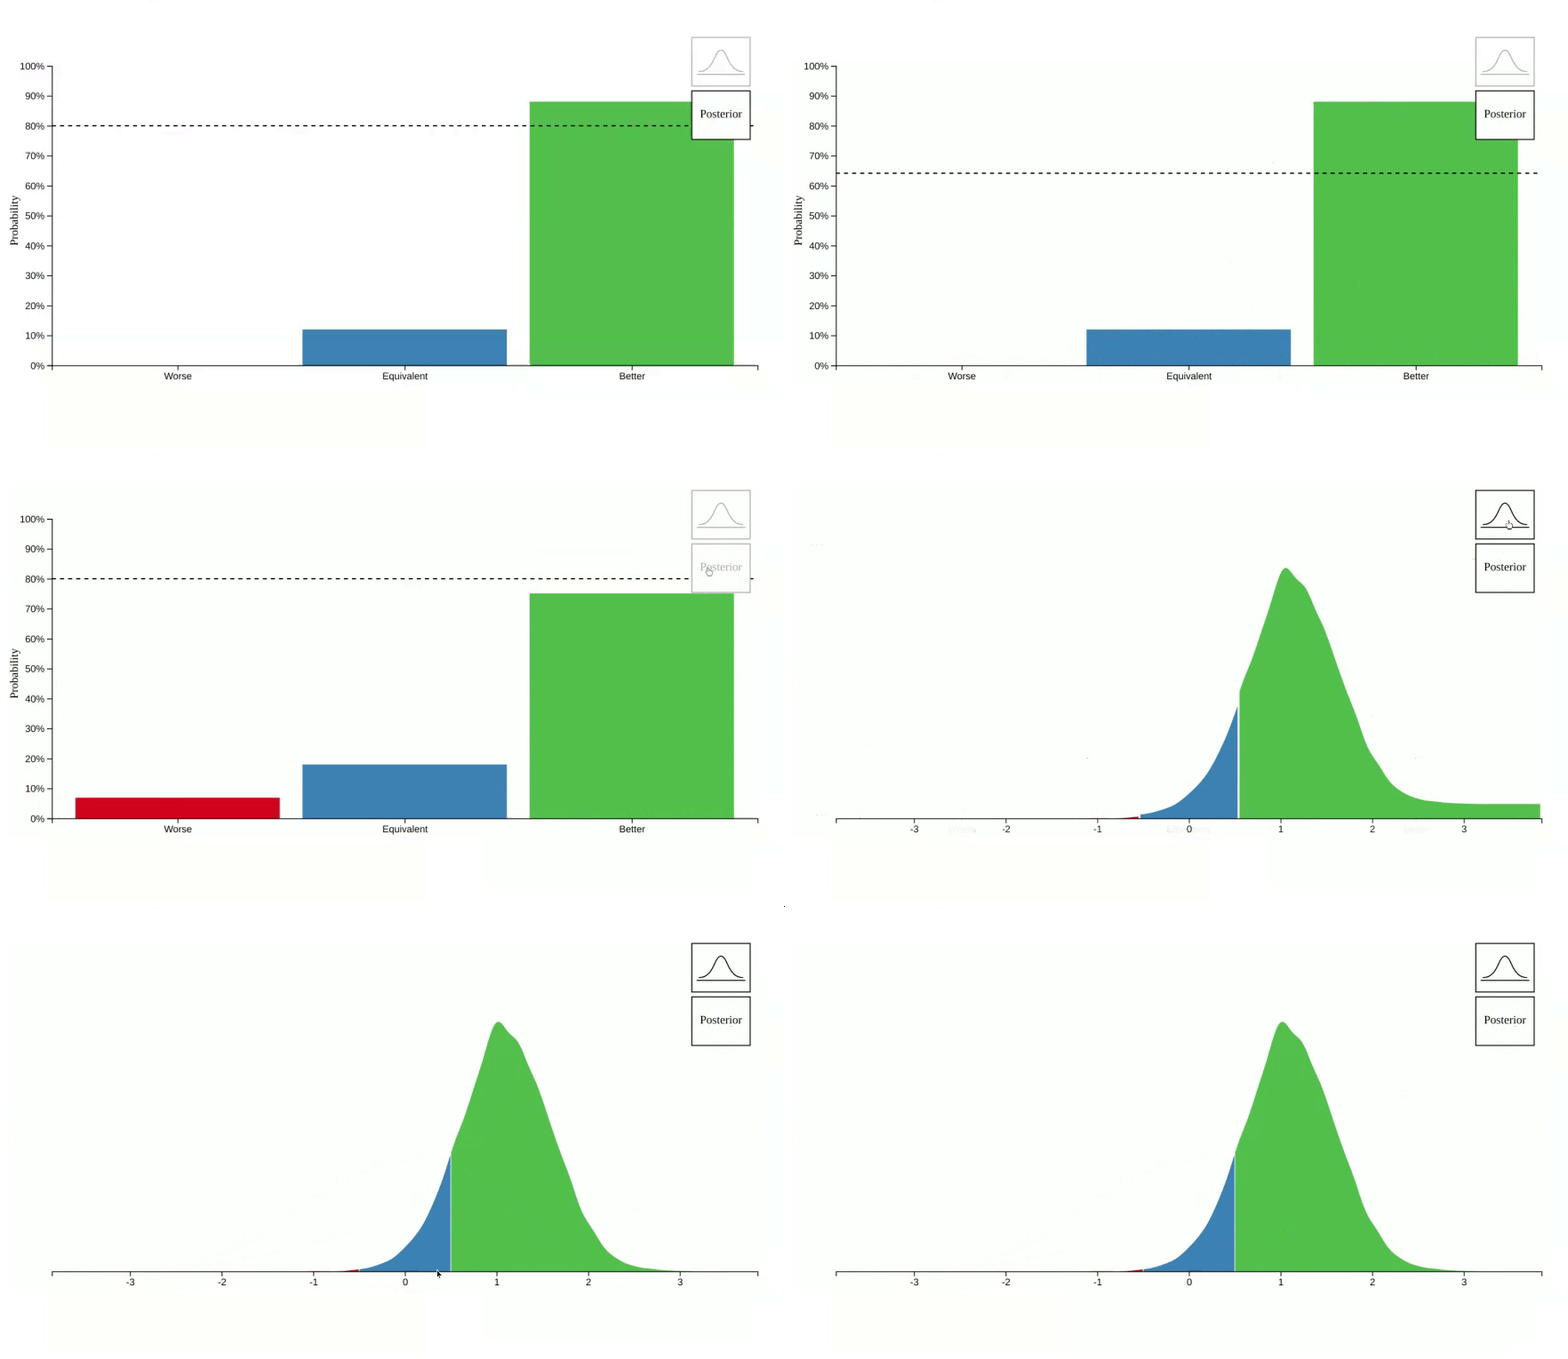
This is a example which shows you how to how to visualize the transition
from the prior to the posterior:
library(vizdraws)
set.seed(9782)
vizdraws(prior = rnorm(10000, 0, 1), posterior = rnorm(10000, 1.1, 0.5), MME = 0.5, threshold = 0.8)

Notes
The bell-curve icon was created by Davo
Sime.
Try the vizdraws package in your browser
Any scripts or data that you put into this service are public.
vizdraws documentation built on May 29, 2024, 10:29 a.m.
vizdraws
vizdraws creates interactive visualizations using draws from a prior and posterior distributions.
Installation
install.packages('vizdraws')
The latest development version can be installed from github:
# install.packages("remotes")
remotes::install_github('ignacio82/vizdraws')
Example
This is a example which shows you how to how to visualize the transition from the prior to the posterior:
library(vizdraws)
set.seed(9782)
vizdraws(prior = rnorm(10000, 0, 1), posterior = rnorm(10000, 1.1, 0.5), MME = 0.5, threshold = 0.8)

Notes
The bell-curve icon was created by Davo Sime.
Try the vizdraws package in your browser
Any scripts or data that you put into this service are public.
Embedding an R snippet on your website
Add the following code to your website.
For more information on customizing the embed code, read Embedding Snippets.
