README.md
In HeathRossie/dlcpr: Easy processing of tracking data from DeepLabCut
dlcpr, R package for processing tracking data
This package is a data processing toolkit for tracking data obtained from DeepLabCut.
DeepLabCut is a software for tracking animal movement and pose estimation based on deep learning (https://github.com/AlexEMG/DeepLabCut). It is available on Python, and produces highly accurate tracking results with 50-200 training data.

A bit tricky part is to pre-process raw trajectories before real analysis. This package is a processing toolkit for that.
To install dlcpr package,
install.package("devtools") # if needed
devtools::install_github("HeathRossie/dlcpr")
Current functionality
| function | usage |
----|----
| read.dlc | read csv file, exported from DeepLabCut |
| read.all | apply read.dlc() to multiple csv files and combine into one data frame |
| get_velocity | estimate velocity by 3rd order approximation |
importing data
DeepLabCut (currently, I am using version 2.0.7.1) produces a tracking result like following.

Tracking example of "Rock-paper-scissors game" tracking can be found "data" section in this page. You can play around with it.
This format is incompatible with ordinary functions to read a csv file (such as read.csv() or fread()).
The function read.dlc() is modified version of fread() from data.table package to easily read a csv file from DeepLabCut.
# import package
library(dlcpr)
# import also dependent package
library(data.table)
library(zoo)

setwd("Your folder path")
d = read.dlc("filename.csv", fps = 30)
The arguments of read.dlc() is as follows;
| argument | |
----|----
| direc (optional) | you can specify the directory where csv files are stored. If not specified, current working directory will be used. |
| fps (optional) | frame-per-second of your camera. If specified, "time" column will be added. |
| spline | If TRUE, it drops frames of low likelihood, and interpolate them. Default is TRUE. |
| threshold | Threshold of likelihood. Default is .90 |
importing all data in a directory
In most situations, we have several videos to analyze, resulting in multiple csv files.
read.all() function applies read.dlc() to all csv files.
setwd("Your Folder Path")
files = list.files(pattern = ".csv")
files
list.files() is not a function from dlcpr package, but useful to get file names in the directory.

Then, read these csv files at once.
d = read.all(files, spline=TRUE, threshold = .9, fps=30)

resulting in a data frame, wchich contains all trajectories.
Each time series of trajectories are indexed by file and ser columns. You can perform futher processes by using these variables.
d$file

d$ser

ser variable is serial numbers assigned to each time series.
For example, height of palm can be visualized as follows;
library(ggplot2)
ggplot(d) +
  geom_line(aes(x=time, y=palm_y, colour=as.factor(ser)))
The arugumen colour=as.factor(ser) enables to depict lines for each time series.

Estimate velocity
A function get_velocity() estimates velocity by 3rd order approximation.
 where v, p, Δt represent velocity, position, time step, respectively.
The first and last frames are dropped and NA is assigned.
where v, p, Δt represent velocity, position, time step, respectively.
The first and last frames are dropped and NA is assigned.
For examole, checking derivation of sin(x) equals to cos(x), since velocity is the first derivative of position.
# d is a data.frame created by read.dlc() or read.all()
d$sin = sin(d$time)
plot(d$sin)
d$vel = get_velocity(d, d$sin)
d$cos = cos(d$time)

# black line represents estimated values and read line represents cosine function
ggplot(d) +
  geom_line(aes(x=time, y=vel)) +
  geom_line(aes(x=time, y=cos), colour="red", lty=2) +
  xlim(0, 10) + xlab("time") + ylab("velocity")

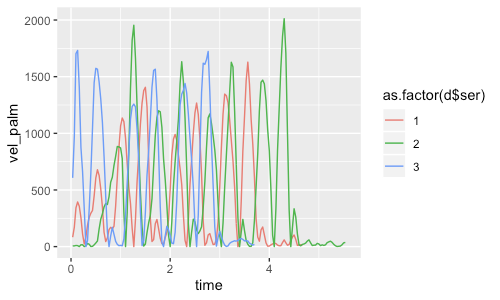
In more realistic situations, we usually have several time series of trajectories.
get_velocity() automatically split the data according to ser variable (serial number), estimate velocity of each time series, and combine them.
For example, in the case that we have three time series in a data frame, which means that read.all() function read three csv files,

we can simply apply get_velocity() to the data frame.
d$vel_palm_x = get_velocity(d, d$palm_x)
d$vel_palm_y = get_velocity(d, d$palm_y)
d$vel_palm = sqrt(d$vel_palm_x^2 + d$vel_palm_y^2)

ggplot(d) +
  geom_line(aes(x=time, y=vel_palm, colour=as.factor(d$ser))) +
  ylab("velocity (pixel/second)")
| argument | |
----|----
| d | data frame created by read.dlc() or read.all() |
| vec | a vector that you are interested in estimating velocity |
HeathRossie/dlcpr documentation built on Oct. 27, 2020, 3:20 p.m.
R Package Documentation
Browse R Packages
We want your feedback!
Note that we can't provide technical support on individual packages. You should contact the package authors for that.
dlcpr, R package for processing tracking data
This package is a data processing toolkit for tracking data obtained from DeepLabCut.
DeepLabCut is a software for tracking animal movement and pose estimation based on deep learning (https://github.com/AlexEMG/DeepLabCut). It is available on Python, and produces highly accurate tracking results with 50-200 training data.
A bit tricky part is to pre-process raw trajectories before real analysis. This package is a processing toolkit for that.
To install dlcpr package,
install.package("devtools") # if needed
devtools::install_github("HeathRossie/dlcpr")
Current functionality
| function | usage | ----|---- | read.dlc | read csv file, exported from DeepLabCut | | read.all | apply read.dlc() to multiple csv files and combine into one data frame | | get_velocity | estimate velocity by 3rd order approximation |
importing data
DeepLabCut (currently, I am using version 2.0.7.1) produces a tracking result like following.
Tracking example of "Rock-paper-scissors game" tracking can be found "data" section in this page. You can play around with it.
This format is incompatible with ordinary functions to read a csv file (such as read.csv() or fread()).
The function read.dlc() is modified version of fread() from data.table package to easily read a csv file from DeepLabCut.
# import package
library(dlcpr)
# import also dependent package
library(data.table)
library(zoo)
setwd("Your folder path")
d = read.dlc("filename.csv", fps = 30)
The arguments of read.dlc() is as follows;
| argument | | ----|---- | direc (optional) | you can specify the directory where csv files are stored. If not specified, current working directory will be used. | | fps (optional) | frame-per-second of your camera. If specified, "time" column will be added. | | spline | If TRUE, it drops frames of low likelihood, and interpolate them. Default is TRUE. | | threshold | Threshold of likelihood. Default is .90 |
importing all data in a directory
In most situations, we have several videos to analyze, resulting in multiple csv files.
read.all() function applies read.dlc() to all csv files.
setwd("Your Folder Path")
files = list.files(pattern = ".csv")
files
list.files() is not a function from dlcpr package, but useful to get file names in the directory.
Then, read these csv files at once.
d = read.all(files, spline=TRUE, threshold = .9, fps=30)
resulting in a data frame, wchich contains all trajectories.
Each time series of trajectories are indexed by file and ser columns. You can perform futher processes by using these variables.
d$file
d$ser
ser variable is serial numbers assigned to each time series.
For example, height of palm can be visualized as follows;
library(ggplot2)
ggplot(d) +
geom_line(aes(x=time, y=palm_y, colour=as.factor(ser)))
The arugumen colour=as.factor(ser) enables to depict lines for each time series.
Estimate velocity
A function get_velocity() estimates velocity by 3rd order approximation.
where v, p, Δt represent velocity, position, time step, respectively.
The first and last frames are dropped and NA is assigned.
For examole, checking derivation of sin(x) equals to cos(x), since velocity is the first derivative of position.
# d is a data.frame created by read.dlc() or read.all()
d$sin = sin(d$time)
plot(d$sin)
d$vel = get_velocity(d, d$sin)
d$cos = cos(d$time)
# black line represents estimated values and read line represents cosine function
ggplot(d) +
geom_line(aes(x=time, y=vel)) +
geom_line(aes(x=time, y=cos), colour="red", lty=2) +
xlim(0, 10) + xlab("time") + ylab("velocity")
In more realistic situations, we usually have several time series of trajectories.
get_velocity() automatically split the data according to ser variable (serial number), estimate velocity of each time series, and combine them.
For example, in the case that we have three time series in a data frame, which means that read.all() function read three csv files,
we can simply apply get_velocity() to the data frame.
d$vel_palm_x = get_velocity(d, d$palm_x)
d$vel_palm_y = get_velocity(d, d$palm_y)
d$vel_palm = sqrt(d$vel_palm_x^2 + d$vel_palm_y^2)
ggplot(d) +
geom_line(aes(x=time, y=vel_palm, colour=as.factor(d$ser))) +
ylab("velocity (pixel/second)")
| argument | | ----|---- | d | data frame created by read.dlc() or read.all() | | vec | a vector that you are interested in estimating velocity |
R Package Documentation
Browse R Packages
We want your feedback!
Note that we can't provide technical support on individual packages. You should contact the package authors for that.
Embedding an R snippet on your website
Add the following code to your website.
For more information on customizing the embed code, read Embedding Snippets.