In ITSLeeds/pct: Propensity to Cycle Tool
# get citations
refs = RefManageR::ReadZotero(group = "418217", .params = list(collection = "JFR868KJ", limit = 100))
refs_df = as.data.frame(refs)
# View(refs_df)
# citr::insert_citation(bib_file = "vignettes/refs_training.bib")
RefManageR::WriteBib(refs, "refs.bib")
# citr::tidy_bib_file(rmd_file = "vignettes/pct_training.Rmd", messy_bibliography = "vignettes/refs_training.bib")
options(htmltools.dir.version = FALSE)
knitr::opts_chunk$set(message = FALSE)
library(RefManageR)
BibOptions(check.entries = FALSE,
           bib.style = "authoryear",
           cite.style = 'alphabetic',
           style = "markdown",
           first.inits = FALSE,
           hyperlink = FALSE,
           dashed = FALSE)
my_bib = refs
library(RefManageR)
my_bib = RefManageR::ReadBib("~/itsleeds/pct/inst/rmd/refs.bib")
# publish results online
cp -Rv ~/itsleeds/pct/data-raw/slides/pct-slides-cac-2021* ~/robinlovelace/static/presentations
# cp -Rv inst/rmd/libs ~/saferactive/site/static/slides/
cd ~/robinlovelace/static/presentations
git add -A
git status
git commit -am 'Update slides'
git push
cd -
background-image: url(https://media.giphy.com/media/YlQQYUIEAZ76o/giphy.gif)
background-size: cover
class: center, middle
How the PCT works
The first prototype of the PCT
-
1st prototype: Hackathon at ODI Leeds in February 2015
-
We identifying key routes and mapped them
-
For description of aims, see Lovelace et al. (2017)
knitr::include_graphics("https://raw.githubusercontent.com/npct/pct-team/master/figures/early.png")
- Launched in 2017 with the Cycling and Walking Investment Strategy (CWIS)

Photo: demo of the PCT to Secretary of State for Transport (March 2017)
The important of open access models

The PCT in 2021
- Now the go-to tool for strategic cycle network planning in England and Wales, used by most local authorities with cycling plans (source).
.pull-left[
Geographic levels in the PCT
- Generate and analyse route networks for transport planning with reference to:
- Zones
- Origin-destination (OD) data
- Geographic desire lines
- Route allocation using different routing services
- Route network generation and analysis
]
.pull-right[
 See these levels at www.pct.bike
]
City simulation layer
Workshop 1
11:30 to 12:30
You will learn about the open datasets provided by the PCT project and how to use them.
While the most common use of the PCT is via the interactive web application hosted at www.pct.bike, there is much value in downloading the data, e.g. to identify existing cycling infrastructure in close proximity to routes with high potential, and to help identify roads in need of interventions from a safety perspective, using data from the constantly evolving and community-driven global geographic database OpenStreetMap (OSM).
In this session, which assumes you have experience using QGIS or R, you will learn how to:
- Find data on travel behaviour from the 2011 Census and from the School Census
- How to download and import data from the PCT into QGIS
- How to process the data alongside infrastructure data, to help find gaps in the network
???
Preliminary timings:
Intro to the workshop and team and demo of the web app: 15 minutes
Working together: downloading PCT data and opening in QGIS (Section 1.2), plus demo of analysis(1.3 and 1.4): 15 minutes
Working together: downloading and opening the zip to see QGIS project (20 minutes 1.4 and 1.5)
Discussion of definition of cycle infrastructure (Joey 5 minutes, 1.5)
Discussion of schools data and merging school and commute route networks (Nathanael 5 minutes)
background-image: url(https://user-images.githubusercontent.com/1825120/130370123-5b8885de-4aed-43b4-8a49-b2f875ffff1b.png)
New training resources
https://itsleeds.github.io/pct/articles/getting.html
Live demo of the PCT for North Yorkshire
See https://www.pct.bike/
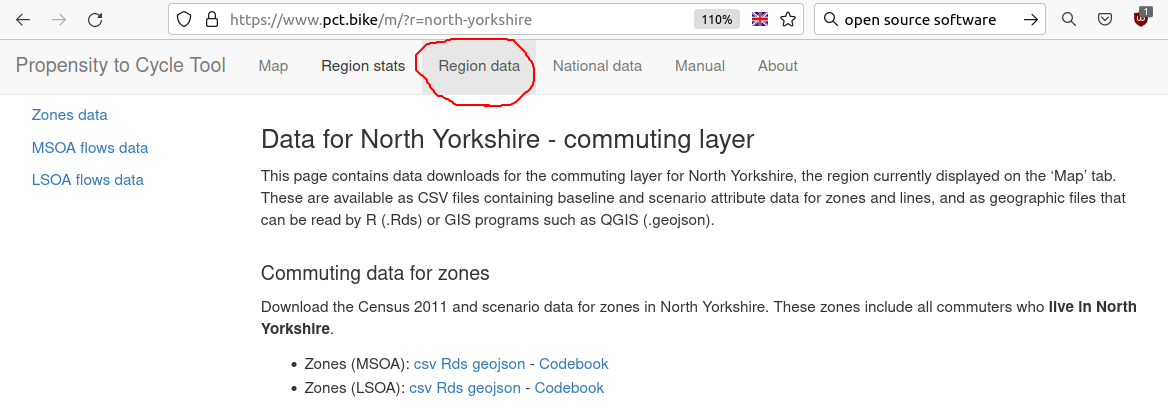
Getting PCT data from the PCT website
See Section 1.2 of the training materials at https://itsleeds.github.io/pct/articles/getting.html
Loading PCT data into QGIS
See Section 1.3 of the training materials at https://itsleeds.github.io/pct/articles/getting.html

Comparing PCT data with infrastructure data and gaps in the network
See Section 1.4 of the training materials at https://itsleeds.github.io/pct/articles/getting.html
Download zip file from https://github.com/ITSLeeds/pct/releases/download/0.8.0/pctqgis.zip

Getting PCT data in R
See Section 1.6 of the training materials at https://itsleeds.github.io/pct/articles/getting.html
library(pct)
library(sf)      # key package for working with spatial vector data
library(dplyr)   # in the tidyverse
library(tmap)    # installed alongside mapview
region_name = "north-yorkshire"
zones_all = get_pct_zones(region_name)
Next steps with QGIS and R
After hearing from many people who were interested in my #QGIS and #Python courses, but could not afford the online instructor-led classes - I have made all 6 courses available for free for self-study. Full material and data packages are at https://t.co/Sgy4zsx6rT pic.twitter.com/tlqV9nV5L0
— Ujaval Gandhi (@spatialthoughts) August 21, 2020
Source: https://twitter.com/spatialthoughts/status/1296821055604969473
On the R side, the Transport section of Geocomputation with R
Workshop 2
See Section 2 of itsleeds.github.io/pct/articles/getting.html
Designed for people with experience with the PCT and cycling uptake estimates who want to learn more about how uptake models work and how to generate new scenarios of change.
Reproducible and open R code will be used to demonstrate the concepts so knowledge of R or other programming languages is recommended but not essential, as there will be conceptual exercises covering the factors linked to mode shift.
In it you will:
- Learn about the uptake model underlying the Propensity to Cycle Tool scenarios
- Develop your own uptake model in conceptual terms, e.g., to represent the government's aim for 50% of all trips in towns and cities to be made by walking and cycling by 2030
- Learn how to train uptake models against data, to build evidence-based uptake models
Preliminary timings
Timings for CCA conference:
Intro: 5 minutes
Set-up: 15 minutes, all working together
Demo of PCT scenarios: 15 minutes
Scenarios of change 15 minutes
Training an update model + questions 10 minutes
The workbook
See https://www.robinlovelace.net/presentations/pct-slides-cac-2021.html#1
.pull-left[
Uses of the PCT
- Visioning
- Planning strategic cycle networks
- Identifying corridors with high latent demand
Uses that were not initially planned
- Pop-up cycleway planning
- LTN planning?
]
--
.pull-right[
Deploying in new contexts
- Requires survey based or synthetic OD data, to be processed by software developed at Leeds
r Citep(my_bib, "lovelace_stplanr:_2018", .opts = list(cite.style = "authoryear"))
- For mor on methods, see the transport chapter (available free online)
r Citep(my_bib, "lovelace_geocomputation_2019", .opts = list(cite.style = "authoryear"))
- Can also be used for specific contexts (e.g. cycling to school, cycling to public transport)
r Citep(my_bib, "goodman_scenarios_2019", .opts = list(cite.style = "authoryear"))
]
--
For further info, see the training materials at itsleeds.github.io
Many use cases on the PCT website: pct.bike/manual.html
- Case studies of over a dozen areas, including Greater Manchester and Herefordshire in the manual
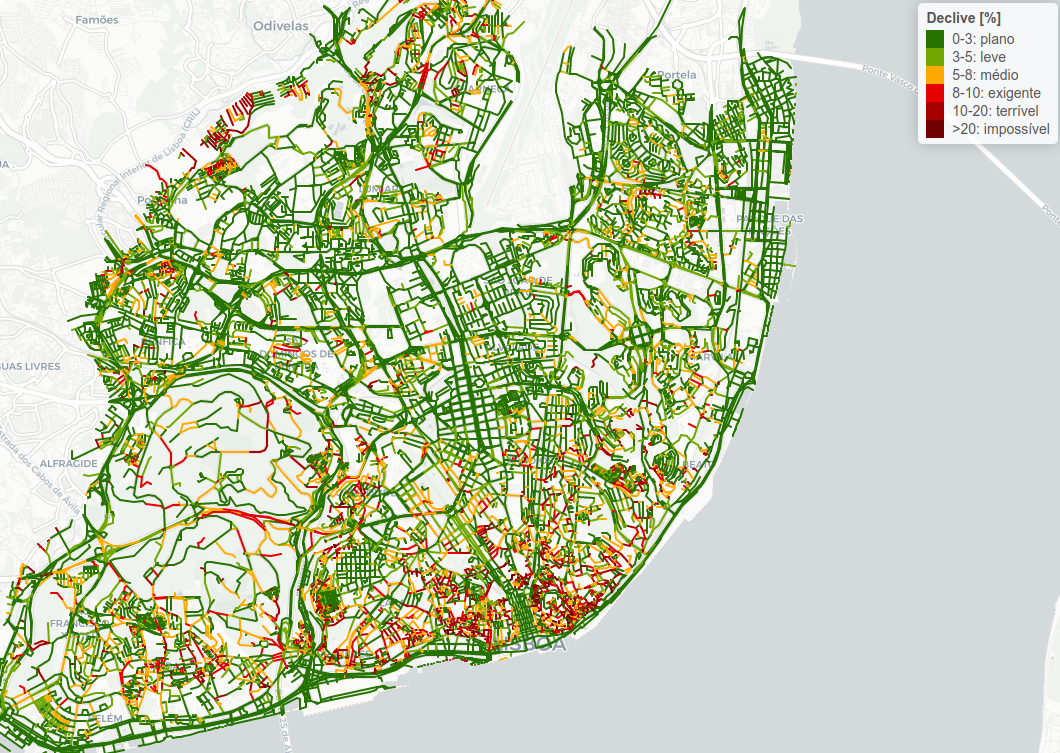
New possibilities in the PCT approach
See web.tecnico.ulisboa.pt for interactive map
background-image: url(https://raw.githubusercontent.com/saferactive/saferactive/master/figures/la-multipliers.gif)
--
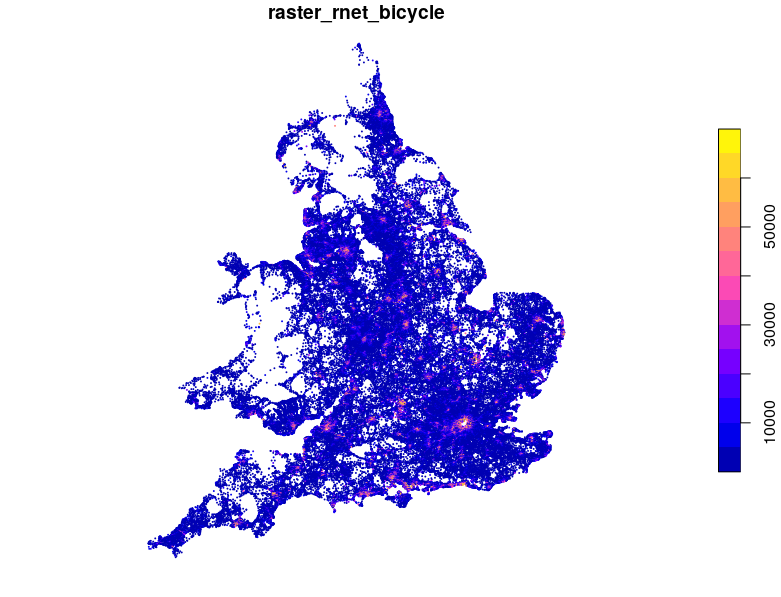
Estimating change in exposure
Tackling denominator neglect
![]()
Estimating safety levels in KSI/bkm at high resolution
Estimating health benefits of cycling uptake with the PCT
- The PCT uses a modified version of the HEAT methodology to calculate health benefits of scenarios of change
- Based on the DfT's TAG methodology
- The scenarios are what if scenarios not forecasts
- See the PCT manual for further information: pct.bike/manual.html
- See the DfT's AMAT tool also

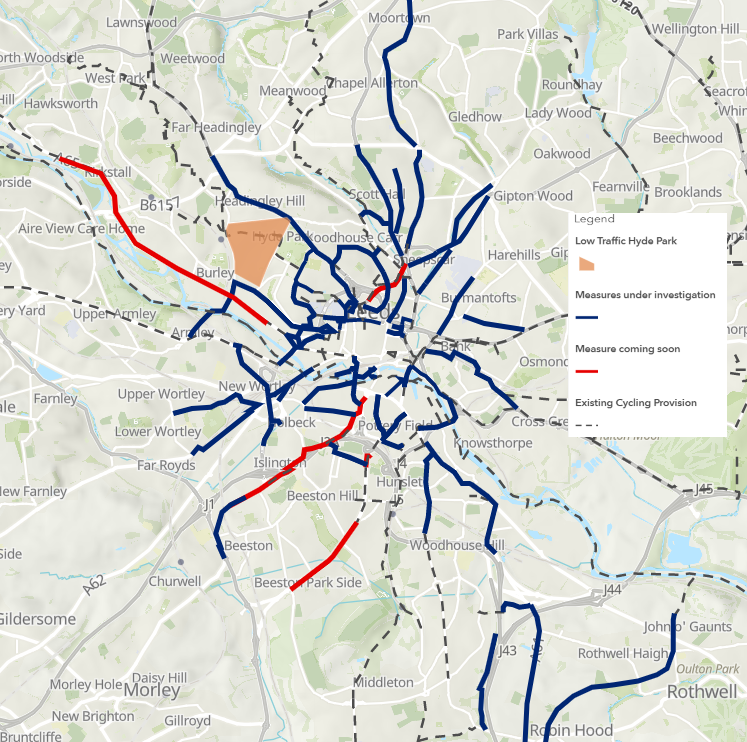
From evidence to network plans
Plans from Leeds City Council responding to national guidance and funding for 'pop-up' cycleways (image credit: Leeds City Council):
background-image: url(https://raw.githubusercontent.com/cyipt/popupCycleways/master/figures/results-top-leeds.png)
The Rapid tool - see cyipt.bike/rapid
References
PrintBibliography(my_bib)
# RefManageR::WriteBib(my_bib, "refs-geostat.bib")
ITSLeeds/pct documentation built on April 13, 2025, 5:49 p.m.
R Package Documentation
Browse R Packages
We want your feedback!
Note that we can't provide technical support on individual packages. You should contact the package authors for that.
# get citations refs = RefManageR::ReadZotero(group = "418217", .params = list(collection = "JFR868KJ", limit = 100)) refs_df = as.data.frame(refs) # View(refs_df) # citr::insert_citation(bib_file = "vignettes/refs_training.bib") RefManageR::WriteBib(refs, "refs.bib") # citr::tidy_bib_file(rmd_file = "vignettes/pct_training.Rmd", messy_bibliography = "vignettes/refs_training.bib") options(htmltools.dir.version = FALSE) knitr::opts_chunk$set(message = FALSE) library(RefManageR) BibOptions(check.entries = FALSE, bib.style = "authoryear", cite.style = 'alphabetic', style = "markdown", first.inits = FALSE, hyperlink = FALSE, dashed = FALSE) my_bib = refs
library(RefManageR) my_bib = RefManageR::ReadBib("~/itsleeds/pct/inst/rmd/refs.bib")
# publish results online cp -Rv ~/itsleeds/pct/data-raw/slides/pct-slides-cac-2021* ~/robinlovelace/static/presentations # cp -Rv inst/rmd/libs ~/saferactive/site/static/slides/ cd ~/robinlovelace/static/presentations git add -A git status git commit -am 'Update slides' git push cd -
background-image: url(https://media.giphy.com/media/YlQQYUIEAZ76o/giphy.gif) background-size: cover class: center, middle
How the PCT works
The first prototype of the PCT
-
1st prototype: Hackathon at ODI Leeds in February 2015
-
We identifying key routes and mapped them
-
For description of aims, see Lovelace et al. (2017)
knitr::include_graphics("https://raw.githubusercontent.com/npct/pct-team/master/figures/early.png")
- Launched in 2017 with the Cycling and Walking Investment Strategy (CWIS)
Photo: demo of the PCT to Secretary of State for Transport (March 2017)
The important of open access models
The PCT in 2021
- Now the go-to tool for strategic cycle network planning in England and Wales, used by most local authorities with cycling plans (source).
.pull-left[
Geographic levels in the PCT
- Generate and analyse route networks for transport planning with reference to:
- Zones
- Origin-destination (OD) data
- Geographic desire lines
- Route allocation using different routing services
- Route network generation and analysis ]
.pull-right[
See these levels at www.pct.bike
]
City simulation layer
Workshop 1
11:30 to 12:30
You will learn about the open datasets provided by the PCT project and how to use them. While the most common use of the PCT is via the interactive web application hosted at www.pct.bike, there is much value in downloading the data, e.g. to identify existing cycling infrastructure in close proximity to routes with high potential, and to help identify roads in need of interventions from a safety perspective, using data from the constantly evolving and community-driven global geographic database OpenStreetMap (OSM).
In this session, which assumes you have experience using QGIS or R, you will learn how to:
- Find data on travel behaviour from the 2011 Census and from the School Census
- How to download and import data from the PCT into QGIS
- How to process the data alongside infrastructure data, to help find gaps in the network
???
Preliminary timings:
Intro to the workshop and team and demo of the web app: 15 minutes
Working together: downloading PCT data and opening in QGIS (Section 1.2), plus demo of analysis(1.3 and 1.4): 15 minutes
Working together: downloading and opening the zip to see QGIS project (20 minutes 1.4 and 1.5)
Discussion of definition of cycle infrastructure (Joey 5 minutes, 1.5)
Discussion of schools data and merging school and commute route networks (Nathanael 5 minutes)
background-image: url(https://user-images.githubusercontent.com/1825120/130370123-5b8885de-4aed-43b4-8a49-b2f875ffff1b.png)
New training resources
https://itsleeds.github.io/pct/articles/getting.html
Live demo of the PCT for North Yorkshire
See https://www.pct.bike/
Getting PCT data from the PCT website
See Section 1.2 of the training materials at https://itsleeds.github.io/pct/articles/getting.html
Loading PCT data into QGIS
See Section 1.3 of the training materials at https://itsleeds.github.io/pct/articles/getting.html
Comparing PCT data with infrastructure data and gaps in the network
See Section 1.4 of the training materials at https://itsleeds.github.io/pct/articles/getting.html
Download zip file from https://github.com/ITSLeeds/pct/releases/download/0.8.0/pctqgis.zip
Getting PCT data in R
See Section 1.6 of the training materials at https://itsleeds.github.io/pct/articles/getting.html
library(pct) library(sf) # key package for working with spatial vector data library(dplyr) # in the tidyverse library(tmap) # installed alongside mapview region_name = "north-yorkshire" zones_all = get_pct_zones(region_name)
Next steps with QGIS and R
After hearing from many people who were interested in my #QGIS and #Python courses, but could not afford the online instructor-led classes - I have made all 6 courses available for free for self-study. Full material and data packages are at https://t.co/Sgy4zsx6rT pic.twitter.com/tlqV9nV5L0
— Ujaval Gandhi (@spatialthoughts) August 21, 2020
Source: https://twitter.com/spatialthoughts/status/1296821055604969473
On the R side, the Transport section of Geocomputation with R
Workshop 2
See Section 2 of itsleeds.github.io/pct/articles/getting.html
Designed for people with experience with the PCT and cycling uptake estimates who want to learn more about how uptake models work and how to generate new scenarios of change. Reproducible and open R code will be used to demonstrate the concepts so knowledge of R or other programming languages is recommended but not essential, as there will be conceptual exercises covering the factors linked to mode shift. In it you will:
- Learn about the uptake model underlying the Propensity to Cycle Tool scenarios
- Develop your own uptake model in conceptual terms, e.g., to represent the government's aim for 50% of all trips in towns and cities to be made by walking and cycling by 2030
- Learn how to train uptake models against data, to build evidence-based uptake models
Preliminary timings
Timings for CCA conference:
Intro: 5 minutes
Set-up: 15 minutes, all working together
Demo of PCT scenarios: 15 minutes
Scenarios of change 15 minutes
Training an update model + questions 10 minutes
The workbook
See https://www.robinlovelace.net/presentations/pct-slides-cac-2021.html#1
.pull-left[
Uses of the PCT
- Visioning
- Planning strategic cycle networks
- Identifying corridors with high latent demand
Uses that were not initially planned
- Pop-up cycleway planning
- LTN planning?
]
--
.pull-right[
Deploying in new contexts
- Requires survey based or synthetic OD data, to be processed by software developed at Leeds
r Citep(my_bib, "lovelace_stplanr:_2018", .opts = list(cite.style = "authoryear")) - For mor on methods, see the transport chapter (available free online)
r Citep(my_bib, "lovelace_geocomputation_2019", .opts = list(cite.style = "authoryear")) - Can also be used for specific contexts (e.g. cycling to school, cycling to public transport)
r Citep(my_bib, "goodman_scenarios_2019", .opts = list(cite.style = "authoryear"))
]
--
For further info, see the training materials at itsleeds.github.io
Many use cases on the PCT website: pct.bike/manual.html
- Case studies of over a dozen areas, including Greater Manchester and Herefordshire in the manual
New possibilities in the PCT approach
See web.tecnico.ulisboa.pt for interactive map
background-image: url(https://raw.githubusercontent.com/saferactive/saferactive/master/figures/la-multipliers.gif)
--
Estimating change in exposure
Tackling denominator neglect
Estimating safety levels in KSI/bkm at high resolution
Estimating health benefits of cycling uptake with the PCT
- The PCT uses a modified version of the HEAT methodology to calculate health benefits of scenarios of change
- Based on the DfT's TAG methodology
- The scenarios are what if scenarios not forecasts
- See the PCT manual for further information: pct.bike/manual.html
- See the DfT's AMAT tool also
From evidence to network plans
Plans from Leeds City Council responding to national guidance and funding for 'pop-up' cycleways (image credit: Leeds City Council):
background-image: url(https://raw.githubusercontent.com/cyipt/popupCycleways/master/figures/results-top-leeds.png)
The Rapid tool - see cyipt.bike/rapid
References
PrintBibliography(my_bib) # RefManageR::WriteBib(my_bib, "refs-geostat.bib")
R Package Documentation
Browse R Packages
We want your feedback!
Note that we can't provide technical support on individual packages. You should contact the package authors for that.
Embedding an R snippet on your website
Add the following code to your website.
For more information on customizing the embed code, read Embedding Snippets.