README.md
In IsamBenS/KeywordsRegistor: Keywords Registor
3C BenchTool is a set of shiny app designed to establish the efficiency of (over)clustering algorithms as well as optimizing their parameters by trying to maximize the F-score.
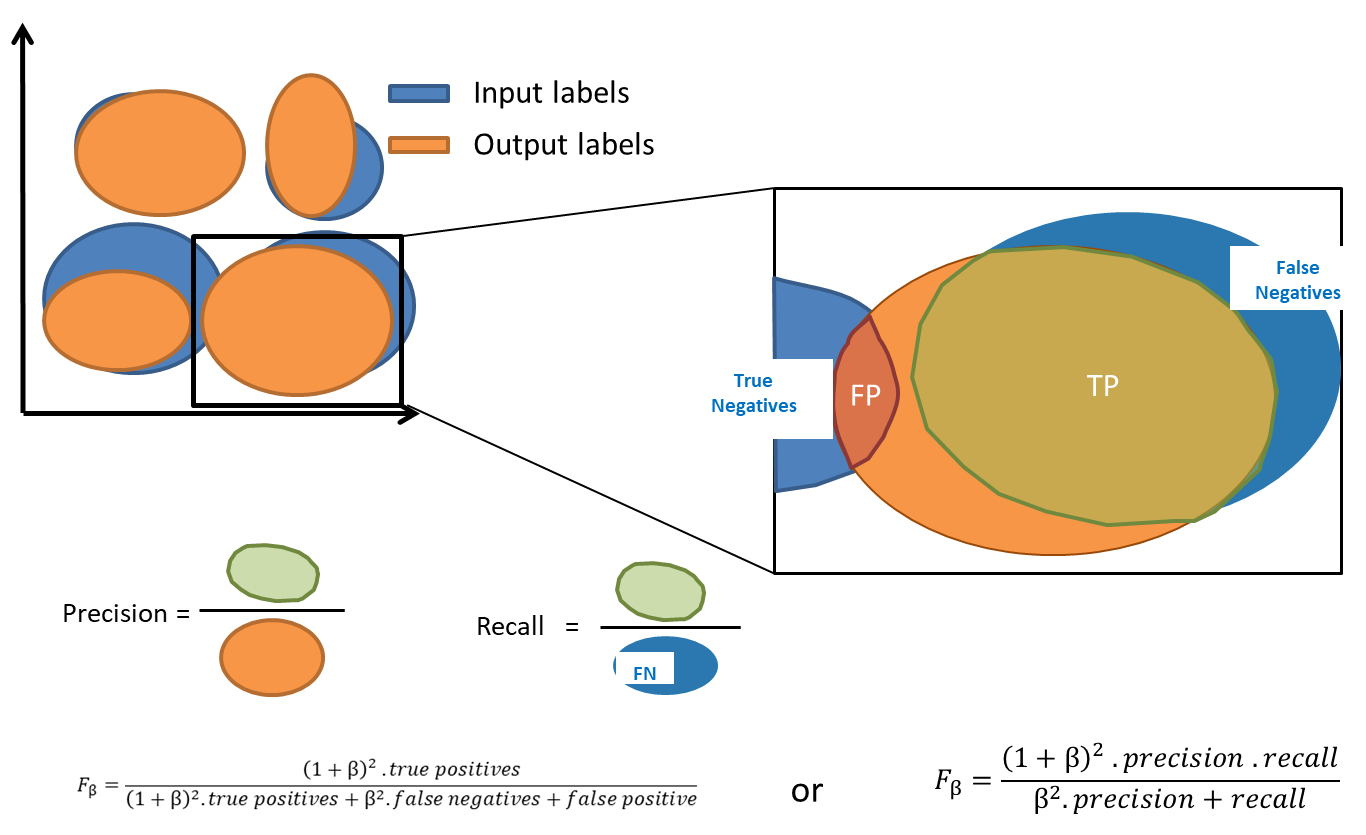
 The F-score is defined as the harmonic mean of precision and recall but can also be expressed as a function of True and False Positives and Negatives. Depending on the type of method -- clustering or overclustering -- the computation of the F-score might be modified:
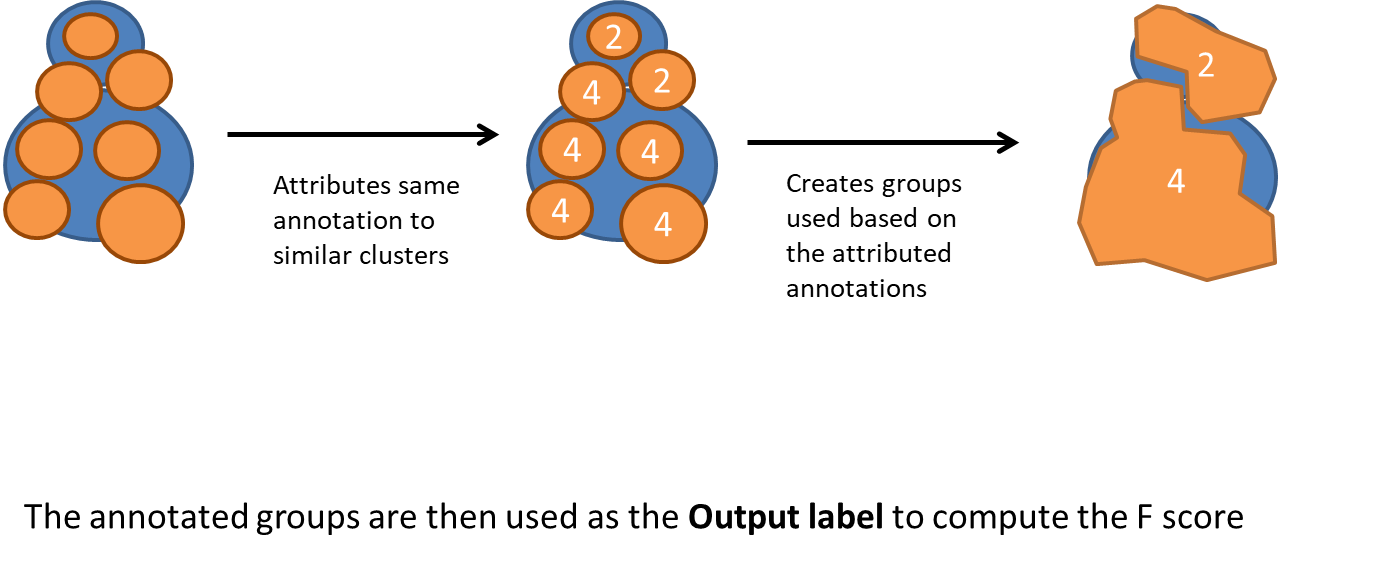
 Overclustering is trickier. We chose to group similar clusters into annotated groups.

The 3 tools composing this toolkit are independant and can be used at different steps of the analysis. If you wish to create enriched files -- clustering your files and adding columns giving the cluster for each event -- use the "3C Clustering Tool)".
If your files were enriched/clustered using an algorithm not supported by 3C Clustering Tool, use "3C Keywords Registor)" to add the keywords enabling the analysis of the different algorithms used.
Finally, once your files are enriched and contain the necessary keywords, you can use "3C Analysis Tool)" visualize the different parameters causing the F-score to vary, thus exposing the issues which can be encountered while running certain algorithms.

3C - Clustering Tool
Shiny app developped to use different clustering algorithms on FCS files. The files are enriched and can then be downloaded and used with the Analysis Tool.
Requirements
- software: R(Version 3.4.3 to 3.5), Rstudio(optional)
- R packages: flowcore, microbenchmark, ncdfFlow, shiny, shinydashboard, shinyjs, doSNOW, cluster, parallel, ggcyto, SPADECiphe
Quick installation guide
- Run the following command in R/RStudio:
install.packages(c("microbenchmark", "shiny", "shinyjs", "shinydashboard","cluster","doSNOW","devtools"))
source("https://bioconductor.org/biocLite.R")
biocLite("ggcyto")
biocLite("flowCore")
biocLite("FlowSOM")
biocLite("ncdfFlow")
You might have to launch a new R session
- Run the next commands:
library("devtools")
install_github("nolanlab/rclusterpp")
install_github("isambens/spadeciphe")
install_github("isambens/ClusteringTool")
Launching the shiny application
- Run the following commands in R/RStudio:
library("ClusteringTool")
ClusteringTool.run()
3C Analysis Tool
Analysis tool used in a pipeline meant to establish the efficiency of clustering algorithms. Developped as a shiny app.
Requirements
- software: R(Version 3.4.3 to 3.5), Rstudio(optional)
- R packages: flowcore, microbenchmark, ncdfFlow, shiny, shinydashboard, shinyjs, DT, RColorBrewer, ggplot2, easyGgplot2
Quick installation guide
- Run the following command in R/RStudio:
install.packages("devtools")
library(devtools)
install_github("kassambara/easyGgplot2")
install.packages(c("microbenchmark","DT", "ggplot2", "RColorBrewer", "shiny", "shinyjs", "shinydashboard"))
source("https://bioconductor.org/biocLite.R")
biocLite("flowCore")
biocLite("ncdfFlow")
You may be asked to reload your environment, if so, accept.
- Run the next commands:
library("devtools")
install_github("isambens/AnalysisTool")
Launching the shiny application
- Run the following commands in R/RStudio:
library("AnalysisTool")
AnalysisTool.run()
3C Keywords Registor
Shiny app used to add keywords to an fcs enriched without Clustering Tool. Prior to Analysis Tool.
Requirements
- software: R(Version 3.4.3 to 3.5), Rstudio(optional)
- R packages: flowcore, shiny, shinydashboard, shinyjs
Quick installation guide
- Run the following command in R/RStudio:
install.packages(c("microbenchmark, "shiny", "shinyjs", "shinydashboard"))
source("https://bioconductor.org/biocLite.R")
biocLite("flowCore")
You may be asked to reload your environment, if so, accept.
- Run the next commands:
library("devtools")
install_github("isambens/KeywordsRegistor")
Launching the shiny application
- Run the following commands in R/RStudio:
library("KeywordsRegistor)
KeywordsRegistor.run()
IsamBenS/KeywordsRegistor documentation built on May 4, 2019, 7:35 a.m.
3C BenchTool is a set of shiny app designed to establish the efficiency of (over)clustering algorithms as well as optimizing their parameters by trying to maximize the F-score.
 The F-score is defined as the harmonic mean of precision and recall but can also be expressed as a function of True and False Positives and Negatives. Depending on the type of method -- clustering or overclustering -- the computation of the F-score might be modified:
 Overclustering is trickier. We chose to group similar clusters into annotated groups.

The 3 tools composing this toolkit are independant and can be used at different steps of the analysis. If you wish to create enriched files -- clustering your files and adding columns giving the cluster for each event -- use the "3C Clustering Tool)".
If your files were enriched/clustered using an algorithm not supported by 3C Clustering Tool, use "3C Keywords Registor)" to add the keywords enabling the analysis of the different algorithms used.
Finally, once your files are enriched and contain the necessary keywords, you can use "3C Analysis Tool)" visualize the different parameters causing the F-score to vary, thus exposing the issues which can be encountered while running certain algorithms.

3C - Clustering Tool
Shiny app developped to use different clustering algorithms on FCS files. The files are enriched and can then be downloaded and used with the Analysis Tool.
Requirements
- software: R(Version 3.4.3 to 3.5), Rstudio(optional)
- R packages: flowcore, microbenchmark, ncdfFlow, shiny, shinydashboard, shinyjs, doSNOW, cluster, parallel, ggcyto, SPADECiphe
Quick installation guide
- Run the following command in R/RStudio:
install.packages(c("microbenchmark", "shiny", "shinyjs", "shinydashboard","cluster","doSNOW","devtools"))
source("https://bioconductor.org/biocLite.R")
biocLite("ggcyto")
biocLite("flowCore")
biocLite("FlowSOM")
biocLite("ncdfFlow")
You might have to launch a new R session
- Run the next commands:
library("devtools")
install_github("nolanlab/rclusterpp")
install_github("isambens/spadeciphe")
install_github("isambens/ClusteringTool")
Launching the shiny application
- Run the following commands in R/RStudio:
library("ClusteringTool")
ClusteringTool.run()
3C Analysis Tool
Analysis tool used in a pipeline meant to establish the efficiency of clustering algorithms. Developped as a shiny app.
Requirements
- software: R(Version 3.4.3 to 3.5), Rstudio(optional)
- R packages: flowcore, microbenchmark, ncdfFlow, shiny, shinydashboard, shinyjs, DT, RColorBrewer, ggplot2, easyGgplot2
Quick installation guide
- Run the following command in R/RStudio:
install.packages("devtools")
library(devtools)
install_github("kassambara/easyGgplot2")
install.packages(c("microbenchmark","DT", "ggplot2", "RColorBrewer", "shiny", "shinyjs", "shinydashboard"))
source("https://bioconductor.org/biocLite.R")
biocLite("flowCore")
biocLite("ncdfFlow")
You may be asked to reload your environment, if so, accept.
- Run the next commands:
library("devtools")
install_github("isambens/AnalysisTool")
Launching the shiny application
- Run the following commands in R/RStudio:
library("AnalysisTool")
AnalysisTool.run()
3C Keywords Registor
Shiny app used to add keywords to an fcs enriched without Clustering Tool. Prior to Analysis Tool.
Requirements
- software: R(Version 3.4.3 to 3.5), Rstudio(optional)
- R packages: flowcore, shiny, shinydashboard, shinyjs
Quick installation guide
- Run the following command in R/RStudio:
install.packages(c("microbenchmark, "shiny", "shinyjs", "shinydashboard"))
source("https://bioconductor.org/biocLite.R")
biocLite("flowCore")
You may be asked to reload your environment, if so, accept.
- Run the next commands:
library("devtools")
install_github("isambens/KeywordsRegistor")
Launching the shiny application
- Run the following commands in R/RStudio:
library("KeywordsRegistor)
KeywordsRegistor.run()
Add the following code to your website.
For more information on customizing the embed code, read Embedding Snippets.
