README.md
In JiajinChen/shinyBN: A web application for interactively construct, visualization and inference with Bayesian Network
Introduction
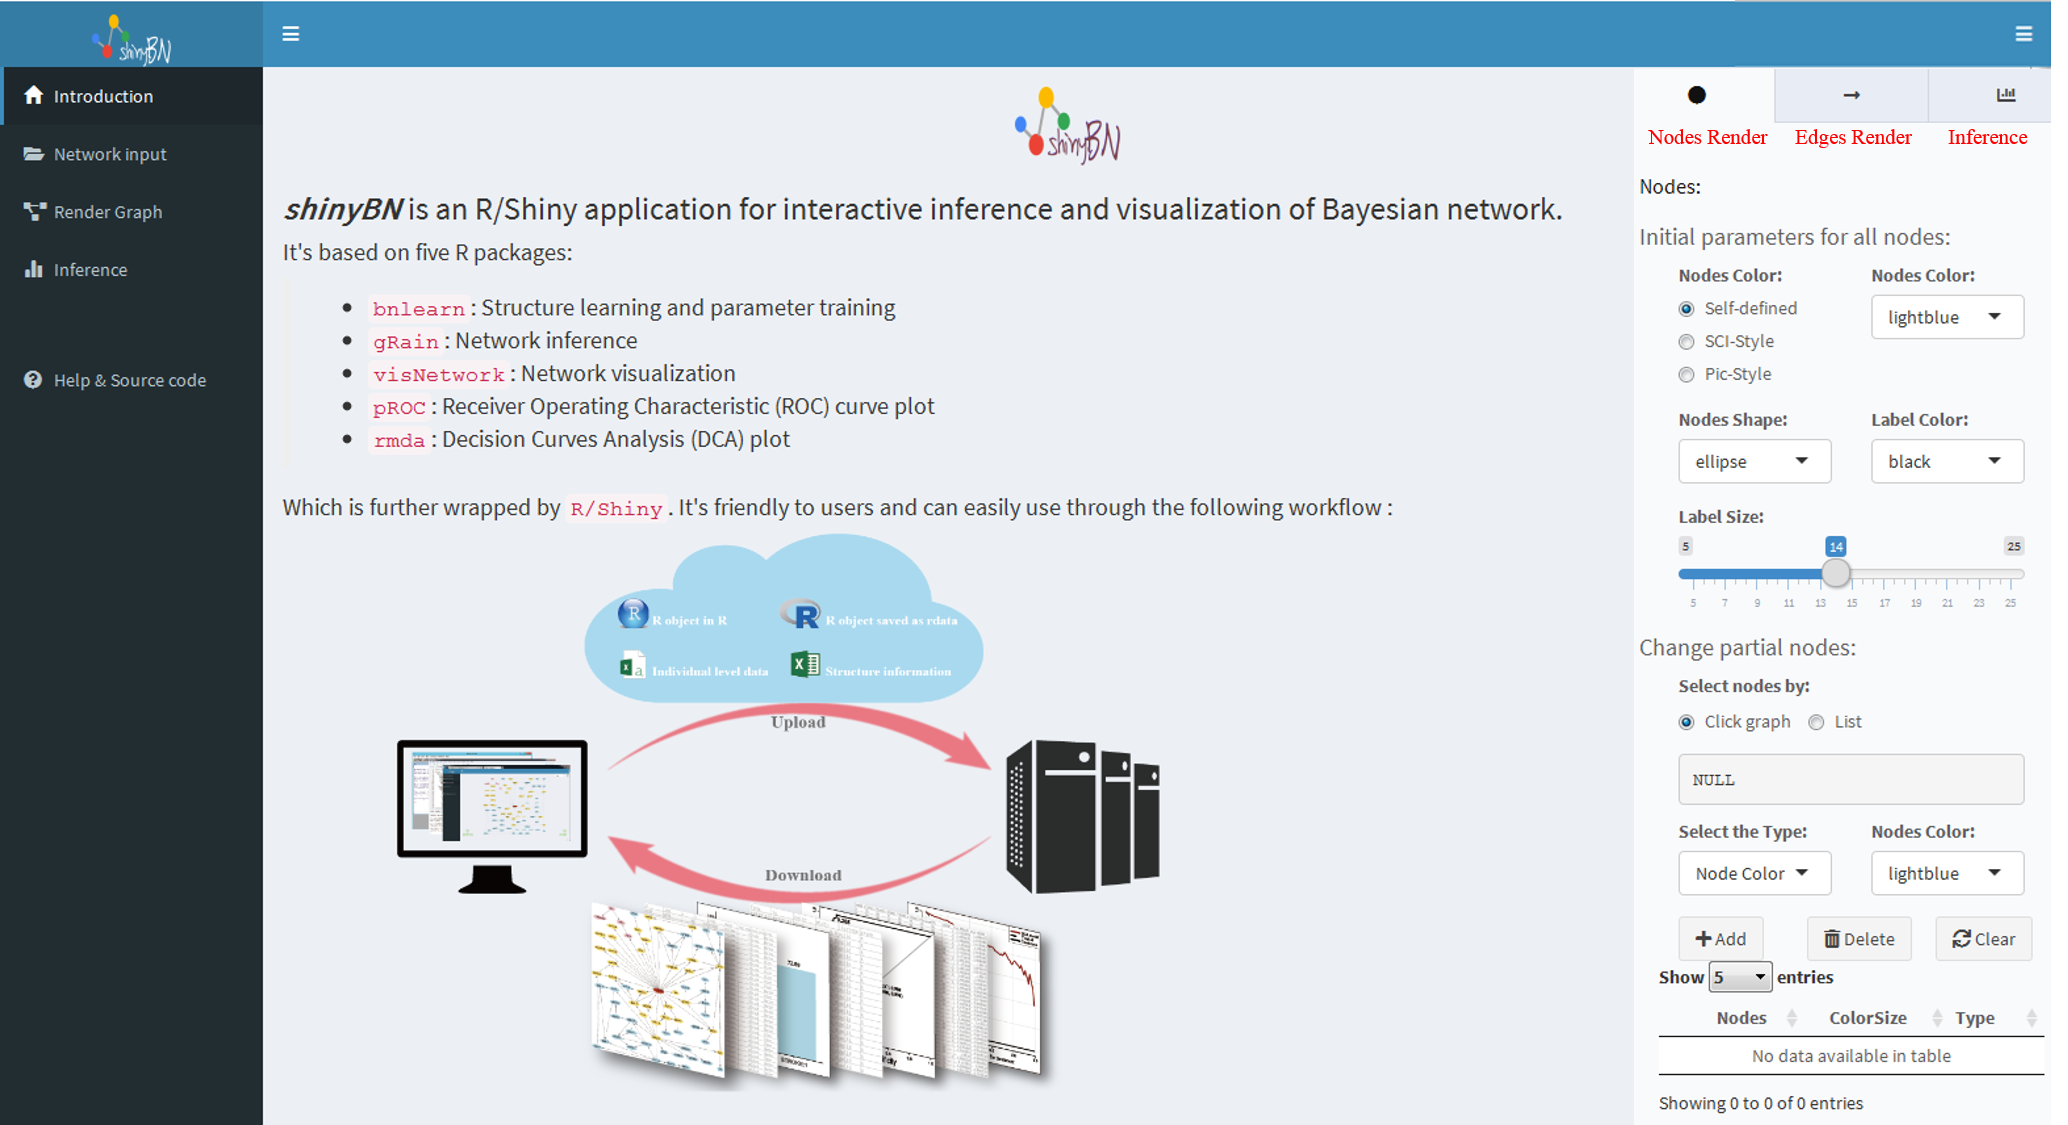
shinyBN is an R/Shiny application for interactive construction, inference and visualization of Bayesian Network, which provide friendly GUI for users lacking of programming skills. It's mainly based on five R packages: bnlearn for structure learning, parameter training, gRain for network inference, and visNetwork for network visualization, pROC and rmda for receiver operating characteristic (ROC) curve and decision curves analysis (DCA) , respectively, which was further wrapped by Shiny, a framework to build interactive web application straight by R.
Get Start
Run APP in R:
Install dependencies:
```{r,eval = FALSE}
install.packages("devtools")
library(devtools)
Packages on CRAN
install.packages(c("shiny","shinydashboard","shinydashboardPlus","sqldf","writexl","readxl","reshape2","DT","bnlearn","ggsci","shinyjqui","ggplot2","visNetwork","pROC","rmda","knitr"))
Packages on Bioconductor
For R version 3.5 or greater, install Bioconductor packages using BiocManager; see https://bioconductor.org/install
if (!requireNamespace("BiocManager", quietly = TRUE)) install.packages("BiocManager")
BiocManager::install(c("gRain","igraph","AnnotationDbi","EBImage"))
Others
source("http://bioconductor.org/biocLite.R")
biocLite(c("gRain","igraph","AnnotationDbi","EBImage"))
Packages on Github
install_github(c("ramnathv/rblocks","woobe/rPlotter"))
Notes: Some R packages are too old, you can install the Old sources from CRAN, of which released before 2019 are proper.
Install *shinyBN* from Github:
```{r,eval = FALSE}
devtools::install_github('JiajinChen/shinyBN')
Launch the APP in R:
{r,eval = FALSE}
shinyBN::run_shinyBN()
Lauch the APP through browser:
Please visit: https://jiajin.shinyapps.io/shinyBN/ or http://bigdata.njmu.edu.cn/shinyBN/
Main Page
How to use
Step 1: Input your Network!
Here, we provide Four type of data input:
- R Object in R : If you trigger shinyBN in R, you can directly upload your Network exist in R environment(class bn or bn.fit).
- R Object(.Rdata) : Upload your Network that save as rdata format(class bn or bn.fit).
- Individual Data(.csv) : Upload individual data and perform structure learning, parameter training in shinyBN.
- Structure in Excel : Upload a Excel with Network information (see Example).

Step 2: Render your Network!
Once your BN is inputed, the plot would present automatically with default parameters. If you are not satisfied with your graphic appearance, you can render your plot with corresponding settings. Additionally, network layout and legend can be set flexibly. Finally, shinyBN provides high-quality images download in HTML output and Network information in Excel.Because the network plot is based on canvas, it's difficult to get SVG. However, we provide a convenient way to get high-resolution images:
- Step1 : Download the high pixel network in HTML format from shinyBN.
- Step2 : Open the HTML file with your browser and adjust the network to the proper size followed by right click to save the image.

- An Example:

Step 3: Inference!
One of the major functions of Bayesian network is inference. You can query the probability of interested nodes given the values of a set of instantiated nodes. shinyBN allowed users to set multiple instantiated nodes and both marginal probability and joint probability are supported, the inference results will be displayed in bar plot or probabilistic table. Users can set different color representing different threshold to distinguish different levels of outcome probability. In addition, you can download the result through a PDF output interface for High-quality images.

- An Example of single prediction:

shinyBN also allowed user to upload a validation set for batch inference. If your validation set contains outcome label, you can get the receiver operating characteristic (ROC) curve plot and decision curves analysis (DCA) plot. The same, both the plot in high-resolution images and batch prediction result in tables are supported.
- An Example of batch prediction:

If you use shinyBN in your work, please cite:
Contact us
If you have any problem or other inquiries you can also email us at ywei@njmu.edu.cn .
JiajinChen/shinyBN documentation built on Sept. 6, 2022, 2:47 p.m.
R Package Documentation
Browse R Packages
We want your feedback!
Note that we can't provide technical support on individual packages. You should contact the package authors for that.
Introduction
shinyBN is an R/Shiny application for interactive construction, inference and visualization of Bayesian Network, which provide friendly GUI for users lacking of programming skills. It's mainly based on five R packages: bnlearn for structure learning, parameter training, gRain for network inference, and visNetwork for network visualization, pROC and rmda for receiver operating characteristic (ROC) curve and decision curves analysis (DCA) , respectively, which was further wrapped by Shiny, a framework to build interactive web application straight by R.
Get Start
Run APP in R:
Install dependencies: ```{r,eval = FALSE} install.packages("devtools") library(devtools)
Packages on CRAN
install.packages(c("shiny","shinydashboard","shinydashboardPlus","sqldf","writexl","readxl","reshape2","DT","bnlearn","ggsci","shinyjqui","ggplot2","visNetwork","pROC","rmda","knitr"))
Packages on Bioconductor
For R version 3.5 or greater, install Bioconductor packages using BiocManager; see https://bioconductor.org/install
if (!requireNamespace("BiocManager", quietly = TRUE)) install.packages("BiocManager") BiocManager::install(c("gRain","igraph","AnnotationDbi","EBImage"))
Others
source("http://bioconductor.org/biocLite.R") biocLite(c("gRain","igraph","AnnotationDbi","EBImage"))
Packages on Github
install_github(c("ramnathv/rblocks","woobe/rPlotter"))
Notes: Some R packages are too old, you can install the Old sources from CRAN, of which released before 2019 are proper.
Install *shinyBN* from Github:
```{r,eval = FALSE}
devtools::install_github('JiajinChen/shinyBN')
Launch the APP in R:
{r,eval = FALSE}
shinyBN::run_shinyBN()
Lauch the APP through browser:
Please visit: https://jiajin.shinyapps.io/shinyBN/ or http://bigdata.njmu.edu.cn/shinyBN/
Main Page
How to use
Step 1: Input your Network!
Here, we provide Four type of data input:
- R Object in R : If you trigger shinyBN in R, you can directly upload your Network exist in R environment(class bn or bn.fit).
- R Object(.Rdata) : Upload your Network that save as rdata format(class bn or bn.fit).
- Individual Data(.csv) : Upload individual data and perform structure learning, parameter training in shinyBN.
- Structure in Excel : Upload a Excel with Network information (see Example).
Step 2: Render your Network!
Once your BN is inputed, the plot would present automatically with default parameters. If you are not satisfied with your graphic appearance, you can render your plot with corresponding settings. Additionally, network layout and legend can be set flexibly. Finally, shinyBN provides high-quality images download in HTML output and Network information in Excel.Because the network plot is based on canvas, it's difficult to get SVG. However, we provide a convenient way to get high-resolution images:
- Step1 : Download the high pixel network in HTML format from shinyBN.
- Step2 : Open the HTML file with your browser and adjust the network to the proper size followed by right click to save the image.
- An Example:
Step 3: Inference!
One of the major functions of Bayesian network is inference. You can query the probability of interested nodes given the values of a set of instantiated nodes. shinyBN allowed users to set multiple instantiated nodes and both marginal probability and joint probability are supported, the inference results will be displayed in bar plot or probabilistic table. Users can set different color representing different threshold to distinguish different levels of outcome probability. In addition, you can download the result through a PDF output interface for High-quality images.
- An Example of single prediction:
shinyBN also allowed user to upload a validation set for batch inference. If your validation set contains outcome label, you can get the receiver operating characteristic (ROC) curve plot and decision curves analysis (DCA) plot. The same, both the plot in high-resolution images and batch prediction result in tables are supported.
- An Example of batch prediction:
If you use shinyBN in your work, please cite:
Contact us
If you have any problem or other inquiries you can also email us at ywei@njmu.edu.cn .
R Package Documentation
Browse R Packages
We want your feedback!
Note that we can't provide technical support on individual packages. You should contact the package authors for that.
Embedding an R snippet on your website
Add the following code to your website.
For more information on customizing the embed code, read Embedding Snippets.