In Junzheshao5959/ssmimputedemo: SSM Imputation DEMO(Title Case)
knitr::opts_chunk$set(
  collapse = TRUE,
  comment = "#>",
  fig.path = "man/figures/README-",
  out.width = "100%"
)
library(knitr)
library(crayon)
library(MASS)
ssmimputedemo
Welcome!
The goal of ssmimputedemo is a testing package for the development of SSMimpute method.
Installation
You can install the development version of ssmimputedemo like so:
``` {r eval = FALSE}
library(devtools)
devtools::install_github("Junzheshao5959/ssmimputedemo")
## Example

This is a basic example which shows you how to solve a common problem:

```r
library(ssmimputedemo)
## basic example code
ssmimputedemo::hello("John")
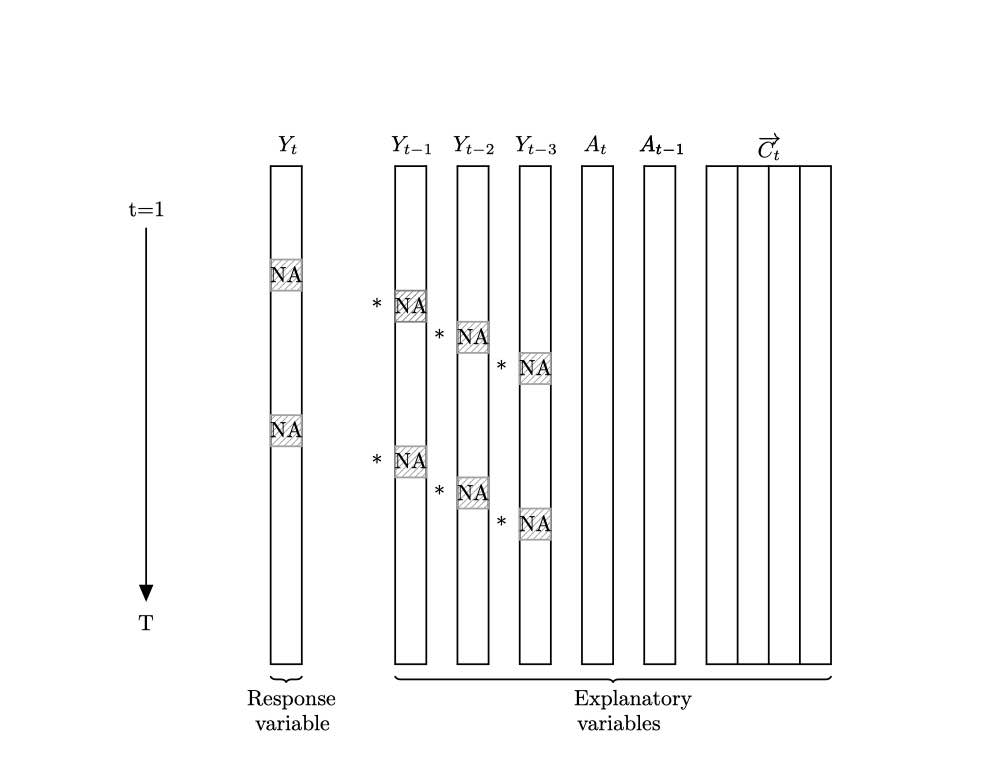
Here is a very basic example when possible change points are same across variables. We considered the following model.
$$
Y_{t}=\beta_{0, t}+0.5 Y_{t-1}+\beta_{1, t} X_{t}-0.5 X_{t-1}-\beta_{c, t}C_{t}+v_{t}, \quad v_{t} \sim N(0,1)
$$
where $\beta_{0, t}$ follows a random walk as $\beta_{0, t}=40+\beta_{0, t-1}+w_{t}$ and $w_{t} \sim N(0,0.25)$, and $\beta_{c, t}=-1$ for $t=1, \ldots, 400, \beta_{c, t}=-2$ for $t=401, \ldots, 700$, and $\beta_{c, t}=0$ for $t=701, \ldots, 1000$.
Here are plots for the sample data set data_space_SSMimpute

?data_space_SSMimpute
?run.SSMimpute_unanimous_cpts
kable(head(data_space_SSMimpute))

imputeTS::ggplot_na_distribution(data_space_SSMimpute$x, color_missing = "pink",color_missing_border = "pink", alpha_missing = 0.9)
imputeTS::ggplot_na_distribution(data_space_SSMimpute$c, color_missing = "pink",color_missing_border = "pink", alpha_missing = 0.9)
printFlag=T
formula="y~y_1+x+x_1"
formula_var=unlist(strsplit(unlist(strsplit(formula,"~"))[2],"+",fixed=T))

ss_param=list(inits=c(log(0.25),log(1)),m0=c(40,0.5,-1,-0.5),C0=diag(rep(10^3),4), AR1_coeffi=NULL,rw_coeffi="intercept", v_cp_param=NULL, w_cp_param=NULL,max_iteration=100)

head(data_space_SSMimpute)

result_statespace_SSMimpute1=run.SSMimpute_unanimous_cpts(data_ss_ori=data_space_SSMimpute,formula_var,ss_param_temp=ss_param,
                                                         initial_imputation_option="StructTS",
                                                         estimate_convergence_cri=0.01,
                                                         lik_convergence_cri=0.01,
                                                         stepsize_for_newpart=1/3,
                                                         max_iteration=100,
                                                         cpt_learning_param=list(cpt_method="mean",burnin=1/10,mergeband=20,convergence_cri=10),
                                                         cpt_initial_guess_option="ignore",
                                                         dlm_option="smooth",m=5,seed=1,printFlag=F)
#kable(result_statespace_SSMimpute1$result_convergence)
#kable(result_statespace_SSMimpute1$result_convergence_mp)
kable(result_statespace_SSMimpute1$result_convergence_mp_addV)
result_statespace_SSMimpute1$estimated_cpts
data_na = result_statespace_SSMimpute1$data_temp
length(data_na$y_1)

data_temp = result_statespace_SSMimpute1$data_temp
missing_part=which(is.na(data_temp$y))[which(is.na(data_temp$y))<nrow(data_temp)]
data_temp$y_1[missing_part+1]=result_statespace_SSMimpute1$y_final
imputeTS::ggplot_na_distribution(data_space_SSMimpute$y_1, color_missing = "pink",color_missing_border = "pink", alpha_missing = 0.9)
imputeTS::ggplot_na_imputations(x_with_na = data_space_SSMimpute$y_1, x_with_imputations = data_na$y_1)
Junzheshao5959/ssmimputedemo documentation built on Aug. 27, 2022, 8:49 a.m.
knitr::opts_chunk$set( collapse = TRUE, comment = "#>", fig.path = "man/figures/README-", out.width = "100%" ) library(knitr) library(crayon) library(MASS)
ssmimputedemo
Welcome!
The goal of ssmimputedemo is a testing package for the development of SSMimpute method.
Installation
You can install the development version of ssmimputedemo like so:
``` {r eval = FALSE} library(devtools) devtools::install_github("Junzheshao5959/ssmimputedemo")
## Example
This is a basic example which shows you how to solve a common problem:
```r
library(ssmimputedemo)
## basic example code
ssmimputedemo::hello("John")
Here is a very basic example when possible change points are same across variables. We considered the following model.
$$
Y_{t}=\beta_{0, t}+0.5 Y_{t-1}+\beta_{1, t} X_{t}-0.5 X_{t-1}-\beta_{c, t}C_{t}+v_{t}, \quad v_{t} \sim N(0,1)
$$
where $\beta_{0, t}$ follows a random walk as $\beta_{0, t}=40+\beta_{0, t-1}+w_{t}$ and $w_{t} \sim N(0,0.25)$, and $\beta_{c, t}=-1$ for $t=1, \ldots, 400, \beta_{c, t}=-2$ for $t=401, \ldots, 700$, and $\beta_{c, t}=0$ for $t=701, \ldots, 1000$.
Here are plots for the sample data set data_space_SSMimpute

?data_space_SSMimpute ?run.SSMimpute_unanimous_cpts kable(head(data_space_SSMimpute)) imputeTS::ggplot_na_distribution(data_space_SSMimpute$x, color_missing = "pink",color_missing_border = "pink", alpha_missing = 0.9) imputeTS::ggplot_na_distribution(data_space_SSMimpute$c, color_missing = "pink",color_missing_border = "pink", alpha_missing = 0.9)
printFlag=T formula="y~y_1+x+x_1" formula_var=unlist(strsplit(unlist(strsplit(formula,"~"))[2],"+",fixed=T)) ss_param=list(inits=c(log(0.25),log(1)),m0=c(40,0.5,-1,-0.5),C0=diag(rep(10^3),4), AR1_coeffi=NULL,rw_coeffi="intercept", v_cp_param=NULL, w_cp_param=NULL,max_iteration=100) head(data_space_SSMimpute) result_statespace_SSMimpute1=run.SSMimpute_unanimous_cpts(data_ss_ori=data_space_SSMimpute,formula_var,ss_param_temp=ss_param, initial_imputation_option="StructTS", estimate_convergence_cri=0.01, lik_convergence_cri=0.01, stepsize_for_newpart=1/3, max_iteration=100, cpt_learning_param=list(cpt_method="mean",burnin=1/10,mergeband=20,convergence_cri=10), cpt_initial_guess_option="ignore", dlm_option="smooth",m=5,seed=1,printFlag=F)
#kable(result_statespace_SSMimpute1$result_convergence) #kable(result_statespace_SSMimpute1$result_convergence_mp) kable(result_statespace_SSMimpute1$result_convergence_mp_addV) result_statespace_SSMimpute1$estimated_cpts
data_na = result_statespace_SSMimpute1$data_temp length(data_na$y_1) data_temp = result_statespace_SSMimpute1$data_temp missing_part=which(is.na(data_temp$y))[which(is.na(data_temp$y))<nrow(data_temp)] data_temp$y_1[missing_part+1]=result_statespace_SSMimpute1$y_final imputeTS::ggplot_na_distribution(data_space_SSMimpute$y_1, color_missing = "pink",color_missing_border = "pink", alpha_missing = 0.9) imputeTS::ggplot_na_imputations(x_with_na = data_space_SSMimpute$y_1, x_with_imputations = data_na$y_1)
Add the following code to your website.
For more information on customizing the embed code, read Embedding Snippets.
