README.md
In KKPMW/annMatrix: Annotated Matrix: Matrices with Persistent Row and Column Annotations


annmatrix
R Annotated Matrix Object
Description
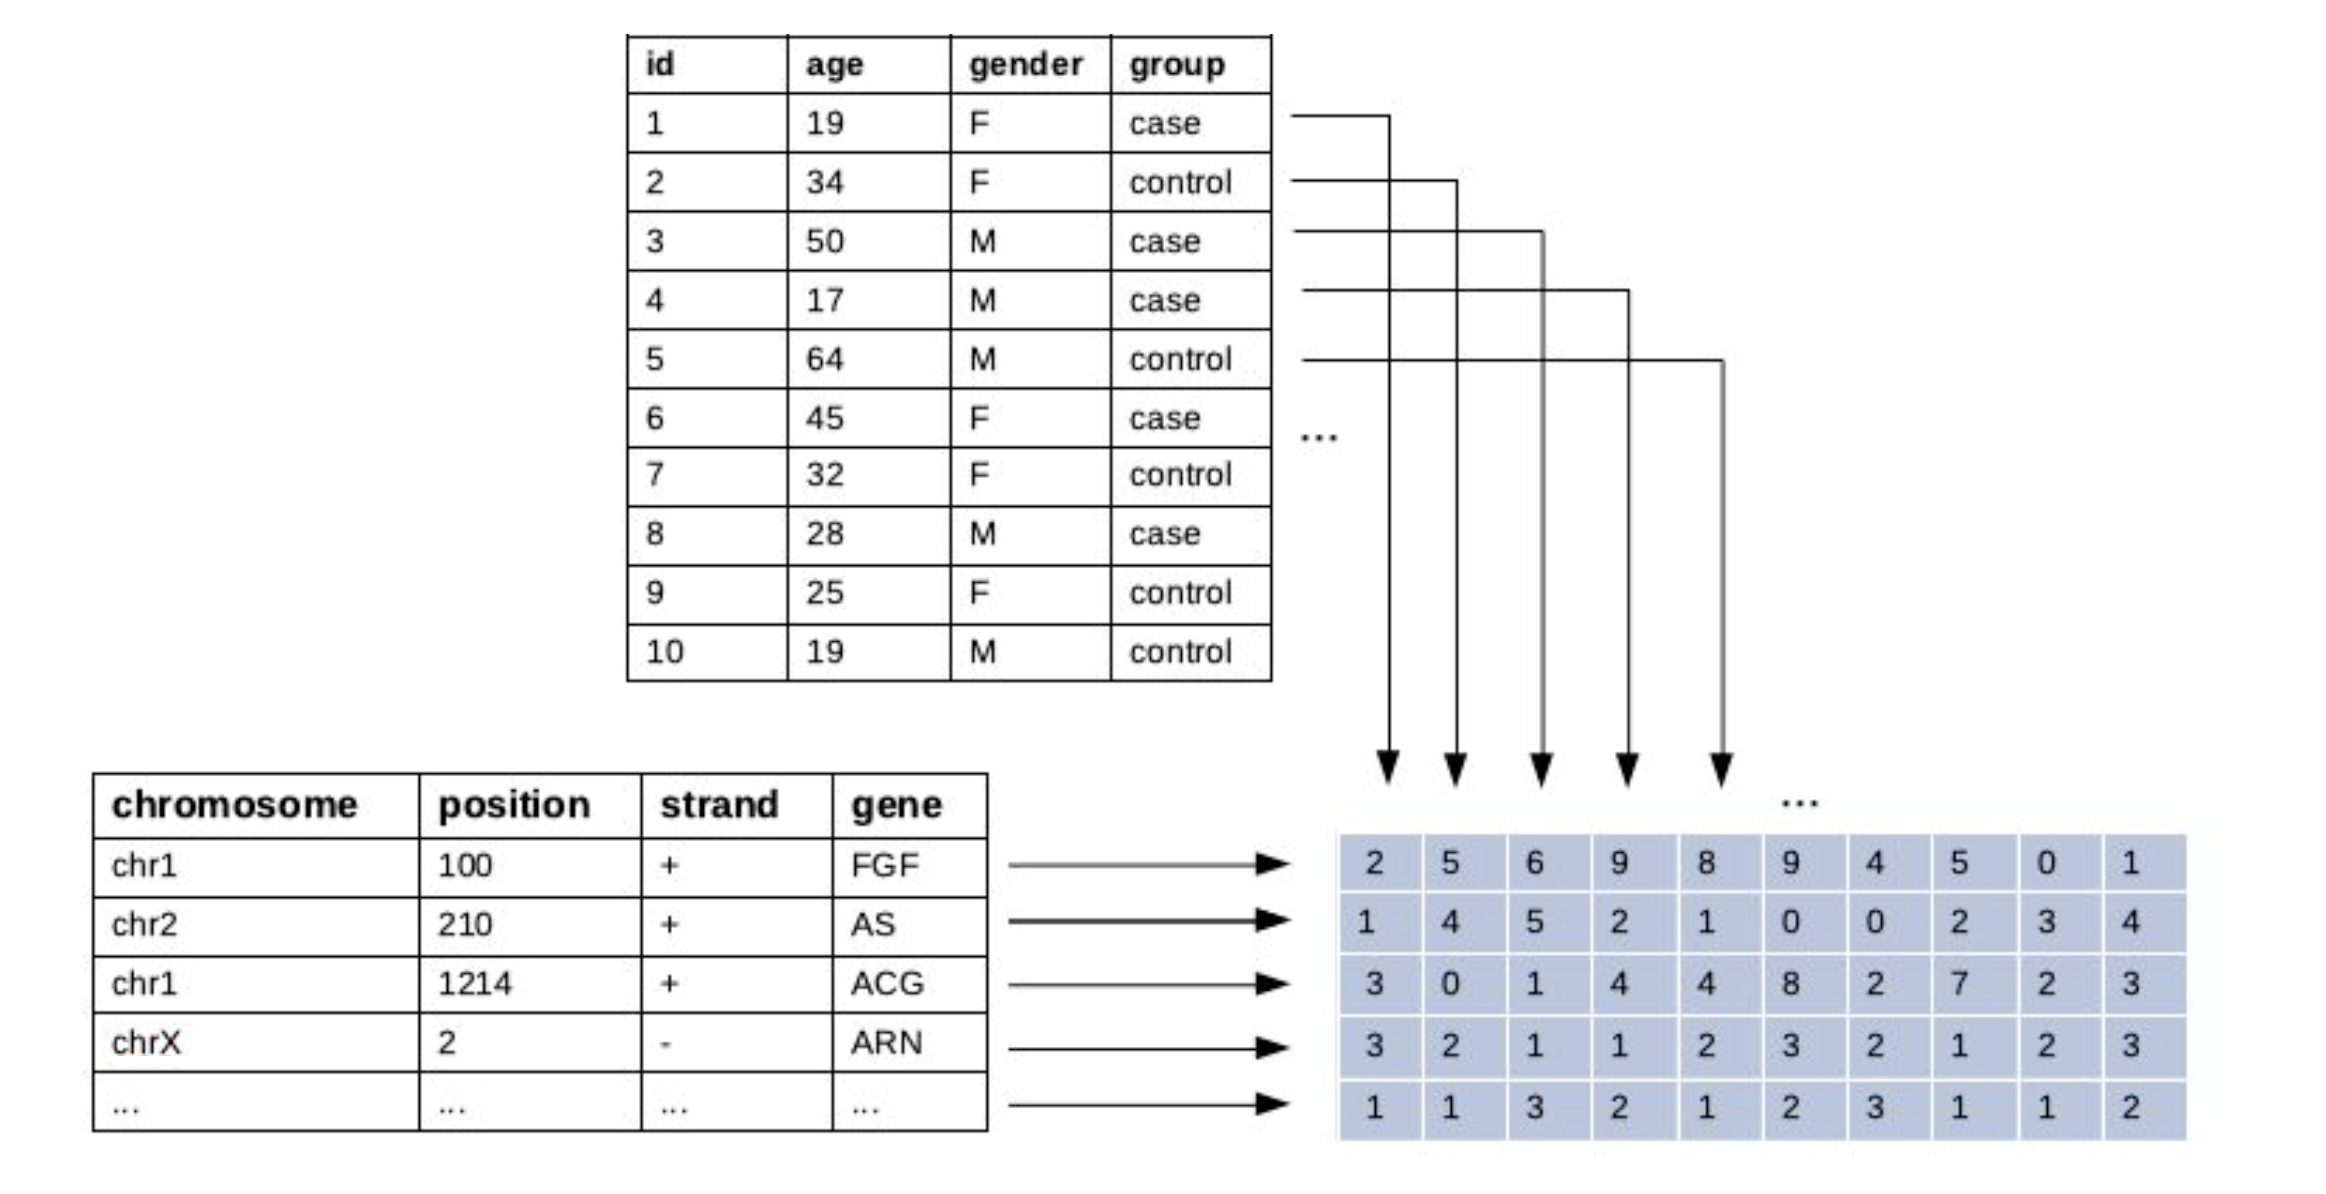
annmatrix implements persistent row and column annotations for R matrices.
The use-case was born out of the need to better organize biomedical microarray and sequencing data within R.
But 'annmatrix' is readily applicable in other contexts where the data can be assembled into a matrix form with rows and columns representing distinct types of information.
The main advantage of 'annmatrix' over BioConductor implementations like SummarizedExperiment and AnnotatedDataFrame is simplicity.
Since 'annmatrix' is based on a matrix, and not a list or a data frame, it behaves like a regular matrix and can be directly passed to various methods that expect a matrix for an input.
Demonstration
Say, we have a small gene expression dataset with 10 genes measured across 6 samples.
mat <- matrix(rnorm(10 * 6), nrow = 10, ncol = 6)

             [,1]       [,2]       [,3]        [,4]         [,5]        [,6]
 [1,] -0.66184983 -0.3828219 -1.2668148 -1.42199245 -0.431174368 -1.86544873
 [2,]  1.71895416  0.2994216 -0.1985833 -0.32822829  0.382446538  1.82998433
 [3,]  2.12166699  0.6742398  0.1388658  0.28457007  0.041125095 -0.99111590
 [4,]  1.49715368 -0.2928163 -0.2793360  0.71933588 -0.059224001 -1.45043462
 [5,] -0.03614058  0.4880534  0.7089194  0.43241598 -1.296423984 -0.01482476
 [6,]  1.23194518  0.8828018 -0.7666105 -0.35192477 -2.136976377  0.53663905
 [7,] -0.06488077  1.8627490  1.4433629  0.29772143 -0.893614686 -0.81110377
 [8,]  1.06899373  1.6117253  0.8448793 -0.26143236  0.612732875 -0.31832480
 [9,] -0.37696531  0.1354795 -0.3993704  1.30868973  0.582971232  1.11147600
[10,]  1.04318309  1.0880860 -1.4277676  0.01587026 -0.005882013 -0.14174471
We can turn this matrix into 'annmatrix' object right away.
X <- as.annmatrix(mat)
When printed annmatrix shows 4 first + the last row and 4 first + the last column from the matrix and lists all available row and column annotations (of which there are currently none).
X

             [,1]        [,2]        [,3]        [,4]                    [,6]
 [1,] -0.66184983 -0.38282188 -1.26681476 -1.42199245 ........... -1.86544873
 [2,]  1.71895416  0.29942160 -0.19858329 -0.32822829 ...........  1.82998433
 [3,]  2.12166699  0.67423976  0.13886578  0.28457007 ........... -0.99111590
 [4,]  1.49715368 -0.29281632 -0.27933600  0.71933588 ........... -1.45043462
      ........... ........... ........... ........... ........... ...........
[10,]  1.04318309  1.08808601 -1.42776759  0.01587026 ........... -0.14174471

rann:
cann:
Custom operators @ and $ are provided for convenient manipulation of row and column data.
Let's add some additional information about our samples.
X$group <- c("case", "case", "case", "control", "control", "control")
X$sex   <- c("F", "M", "M", "M", "F", "F")

X

             [,1]        [,2]        [,3]        [,4]                    [,6]
 [1,] -0.66184983 -0.38282188 -1.26681476 -1.42199245 ........... -1.86544873
 [2,]  1.71895416  0.29942160 -0.19858329 -0.32822829 ...........  1.82998433
 [3,]  2.12166699  0.67423976  0.13886578  0.28457007 ........... -0.99111590
 [4,]  1.49715368 -0.29281632 -0.27933600  0.71933588 ........... -1.45043462
      ........... ........... ........... ........... ........... ...........
[10,]  1.04318309  1.08808601 -1.42776759  0.01587026 ........... -0.14174471

rann:
cann: group, sex
We can add the entire annotation table by assigning to an empty value. Let's do this for rows.
chromosome <- c("chr1", "chr1", "chr1", "chr1", "chr2", "chr2", "chr2", "chr3", "chr3", "chr3")
position   <- runif(10, 0, 1000000)

X@'' <- data.frame(chr = chromosome, pos = position)

X

             [,1]        [,2]        [,3]        [,4]                    [,6]
 [1,] -0.66184983 -0.38282188 -1.26681476 -1.42199245 ........... -1.86544873
 [2,]  1.71895416  0.29942160 -0.19858329 -0.32822829 ...........  1.82998433
 [3,]  2.12166699  0.67423976  0.13886578  0.28457007 ........... -0.99111590
 [4,]  1.49715368 -0.29281632 -0.27933600  0.71933588 ........... -1.45043462
      ........... ........... ........... ........... ........... ...........
[10,]  1.04318309  1.08808601 -1.42776759  0.01587026 ........... -0.14174471

rann: chr, pos
cann: group, sex
Same shortcuts can be used for retrieving available annotations.
X@chr

 [1] "chr1" "chr1" "chr1" "chr1" "chr2" "chr2" "chr2" "chr3" "chr3" "chr3"

X$group

 [1] "case"    "case"    "case"    "control" "control" "control"
As well as for adjusting annotations.
X@pos

 [1] 418638.0 423928.7 248000.4 220840.4 482854.1 662214.0 122708.6 334171.7 219852.3 927672.1

X@pos <- X@pos * 10

X@pos

 [1] 4186380 4239287 2480004 2208404 4828541 6622140 1227086 3341717 2198523 9276721
Or create new ones.
X$age <- seq(10, 60, 10)
X$age

 [1] 10 20 30 40 50 60
When an empty name is provided it will return the whole annotation data.frame.
X$''

    group sex age
1    case   F  10
2    case   M  20
3    case   M  30
4 control   M  40
5 control   F  50
6 control   F  60
When subsetting the annmatrix object all the annotations are correctly adjusted and class is preserved.
X_case <- X[, X$group == "case"]
X_case

            [,1]       [,2]       [,3]
 [1,] -0.6618498 -0.3828219 -1.2668148
 [2,]  1.7189542  0.2994216 -0.1985833
 [3,]  2.1216670  0.6742398  0.1388658
 [4,]  1.4971537 -0.2928163 -0.2793360
      .......... .......... ..........
[10,]  1.0431831  1.0880860 -1.4277676

rann: chr, pos
cann: group, sex, age
X_case$''

  group sex age
1  case   F  10
2  case   M  20
3  case   M  30
However in order to be consistent with matrix the class is dropped when selecting only a single row or column.
X[1,]

 [1] -0.6618498 -0.3828219 -1.2668148 -1.4219925 -0.4311744 -1.8654487
But just like with a matrix we can enforce it to preserve all the annotations and the class by setting drop=FALSE.
X[1,, drop=FALSE]

           [,1]       [,2]       [,3]       [,4]                  [,6]
[1,] -0.6618498 -0.3828219 -1.2668148 -1.4219925 .......... -1.8654487

rann: chr, pos
cann: group, sex, age
Operations on annmatrix object don't loose the class.
X > 0

       [,1]  [,2]  [,3]  [,4]        [,6]
 [1,] FALSE FALSE FALSE FALSE ..... FALSE
 [2,]  TRUE  TRUE FALSE FALSE .....  TRUE
 [3,]  TRUE  TRUE  TRUE  TRUE ..... FALSE
 [4,]  TRUE FALSE FALSE  TRUE ..... FALSE
      ..... ..... ..... ..... ..... .....
[10,]  TRUE  TRUE FALSE  TRUE ..... FALSE

rann: chr, pos
cann: group, sex, age
X <- X - rowMeans(X)
X

             [,1]        [,2]        [,3]        [,4]                    [,6]
 [1,]  0.34316717  0.62219512 -0.26179776 -0.41697545 ........... -0.86043172
 [2,]  1.10162165 -0.31791091 -0.81591579 -0.94556080 ...........  1.21265182
 [3,]  1.74344169  0.29601446 -0.23935952 -0.09365523 ........... -1.36934120
 [4,]  1.47470725 -0.31526276 -0.30178244  0.69688945 ........... -1.47288106
      ........... ........... ........... ........... ........... ...........
[10,]  0.94789225  0.99279517 -1.52305843 -0.07942058 ........... -0.23703556

rann: chr, pos
cann: group, sex, age
Matrix transpose will preserve the class and correctly adjust row and column annotations.
t(X)

            [,1]        [,2]        [,3]        [,4]                   [,10]
[1,]  0.34316717  1.10162165  1.74344169  1.47470725 ...........  0.94789225
[2,]  0.62219512 -0.31791091  0.29601446 -0.31526276 ...........  0.99279517
[3,] -0.26179776 -0.81591579 -0.23935952 -0.30178244 ........... -1.52305843
[4,] -0.41697545 -0.94556080 -0.09365523  0.69688945 ........... -0.07942058
     ........... ........... ........... ........... ........... ...........
[6,] -0.86043172  1.21265182 -1.36934120 -1.47288106 ........... -0.23703556

rann: group, sex, age
cann: chr, pos
Principal component analysis with prcomp will transform the PCA loadings into 'annmatrix' object and add row and column annotations to it, such as proportion of variance explained.
pca <- prcomp(t(X))
pca$rotation

              PC1         PC2         PC3         PC4                     PC6
 [1,]  0.17186228 -0.06111446  0.28479933  0.34143265 ...........  0.06141574
 [2,]  0.07770596  0.56511346 -0.15143694  0.26206867 ........... -0.05690171
 [3,]  0.48808049  0.04486714  0.31834335 -0.16657847 ...........  0.57896252
 [4,]  0.34355333  0.02691052  0.45134983 -0.56375589 ........... -0.52045090
      ........... ........... ........... ........... ........... ...........
[10,]  0.32535557  0.32483324  0.07792832  0.15417554 ...........  0.21093439

rann: chr, pos
cann: pc, sd, var, var_explained


pca$rotation$var_explained

 [1] 3.976151e-01 2.492482e-01 1.991826e-01 8.899235e-02 6.496171e-02 3.582514e-33
Furthermore, matrix cross-product will preserve all annotations that are possible to preserve after the product.
X_scores <- t(pca$rotation) %*% X
X_scores

             [,1]          [,2]          [,3]          [,4]                        [,6]
PC1  2.642132e+00  1.845104e+00 -3.957560e-01 -5.252007e-01 ............. -1.828050e+00
PC2  1.486939e+00 -8.303449e-01 -2.172757e+00 -3.843922e-01 .............  1.723213e+00
PC3  7.210412e-01 -8.182090e-01 -4.038344e-01  1.336113e-01 ............. -1.709567e+00
PC4 -2.734391e-01  8.671400e-01  2.275004e-03 -1.559362e+00 .............  2.337191e-01
    ............. ............. ............. ............. ............. .............
PC6  1.110223e-16  2.220446e-15  2.553513e-15 -1.020364e-14 ............. -2.567391e-16

rann: pc, sd, var, var_explained
cann: group, sex, age


X_scores@''

     pc           sd          var var_explained
PC1 PC1 1.853695e+00 3.436186e+00  3.976151e-01
PC2 PC2 1.467652e+00 2.154001e+00  2.492482e-01
PC3 PC3 1.311996e+00 1.721335e+00  1.991826e-01
PC4 PC4 8.769670e-01 7.690712e-01  8.899235e-02
PC5 PC5 7.492653e-01 5.613986e-01  6.496171e-02
PC6 PC6 1.759547e-16 3.096006e-32  3.582514e-33


X_scores$''

    group sex age
1    case   F  10
2    case   M  20
3    case   M  30
4 control   M  40
5 control   F  50
6 control   F  60
And, of course, we get all the goodies that come from storing our data as a matrix.
# medians of all genes on chromosome 1

library(matrixStats)
rowMedians(X[X@chr == "chr1",])

 [1]  0.04068471 -0.27639844 -0.16650737 -0.19172644


# Gene-wise Bartlett's test for equal variance between cases and control

library(matrixTests)
row_bartlett(X, X$group)

   obs.tot obs.groups var.pooled df   statistic      pvalue
1        6          2  0.3717333  1 0.363202329 0.546733101
2        6          2  1.0998615  1 0.016042378 0.899210686
3        6          2  0.7554444  1 0.268153616 0.604573040
4        6          2  1.1341347  1 0.006848371 0.934046441
5        6          2  0.4758403  1 1.043799502 0.306939452
6        6          2  1.4967384  1 0.093874925 0.759307605
7        6          2  0.7351686  1 0.275875443 0.599417430
8        6          2  0.2139256  1 0.124149137 0.724577269
9        6          2  0.1161703  1 0.073665362 0.786072915
10       6          2  1.0400756  1 6.832203465 0.008952875


# Pearson's correlation test between each gene's expression values and the age of subjects

library(matrixTests)
row_cor_pearson(X, X$age)

   obs.paired        cor df   statistic     pvalue   conf.low   conf.high alternative cor.null conf.level
1           6 -0.5602433  4 -1.35270865 0.24755755 -0.9430338  0.46085636   two.sided        0       0.95
2           6  0.0384372  4  0.07693125 0.94237259 -0.7980176  0.82428560   two.sided        0       0.95
3           6 -0.9092607  4 -4.36906111 0.01197687 -0.9901613 -0.37278589   two.sided        0       0.95
4           6 -0.6950676  4 -1.93357802 0.12529880 -0.9632623  0.26724253   two.sided        0       0.95
5           6 -0.4096758  4 -0.89818427 0.41986507 -0.9165164  0.60205486   two.sided        0       0.95
6           6 -0.5186591  4 -1.21326433 0.29177292 -0.9361660  0.50580928   two.sided        0       0.95
7           6 -0.6143204  4 -1.55710099 0.19443841 -0.9515021  0.39334780   two.sided        0       0.95
8           6 -0.7763522  4 -2.46344001 0.06943424 -0.9741458  0.09517432   two.sided        0       0.95
9           6  0.7663925  4  2.38613079 0.07548443 -0.1194861  0.97285981   two.sided        0       0.95
10          6 -0.4486700  4 -1.00407581 0.37215468 -0.9238398  0.57069431   two.sided        0       0.95
When needed 'annmatrix' can be transformed into a long-format data frame.
stack(X)

            value  chr     pos   group sex age
1:1   0.343167174 chr1 4186380    case   F  10
2:1   1.101621650 chr1 4239287    case   F  10
3:1   1.743441691 chr1 2480004    case   F  10
4:1   1.474707248 chr1 2208404    case   F  10
5:1  -0.083140482 chr2 4828541    case   F  10
6:1   1.332632768 chr2 6622140    case   F  10
...  ............ .... .......    ....   .  ..
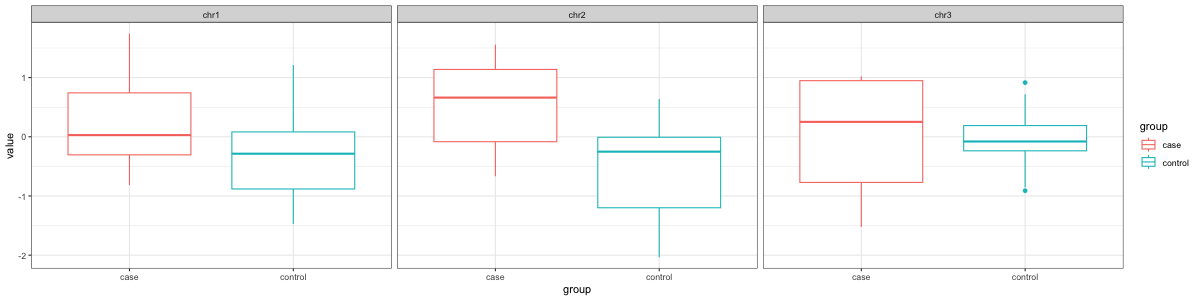
Which then can be used for things like making ggplot2 figures.
# case vs control boxplot by chromosome

library(ggplot2)
ggplot(stack(X), aes(x=group, y=value, color=group)) +
  facet_wrap(~chr) +
  geom_boxplot() +
  theme_bw()
Technical Details
annmatrix uses R's S3 class system to extend the base matrix class in order to provide it with persistent annotations that are associated with rows and columns.
Technically annmatrix object is just a regular R matrix with additional data.frame attributes .annmatrix.rann and .annmatrix.cann that are preserved after sub-setting and other matrix-specific operations.
As a result, every function that works on a matrix by design should work the same way with annmatrix.
Installation
Directly from CRAN:
install.packages("annmatrix")
Or from GitHub, using remotes library:
remotes::install_github("karoliskoncevicius/annmatrix")      # CRAN version
remotes::install_github("karoliskoncevicius/annmatrix@dev")  # stable changes not yet on CRAN
See Also
Similar ideas can be found in:
KKPMW/annMatrix documentation built on May 16, 2023, 3:48 a.m.
R Package Documentation
Browse R Packages
We want your feedback!
Note that we can't provide technical support on individual packages. You should contact the package authors for that.
annmatrix
R Annotated Matrix Object
Description
annmatrix implements persistent row and column annotations for R matrices.
The use-case was born out of the need to better organize biomedical microarray and sequencing data within R. But 'annmatrix' is readily applicable in other contexts where the data can be assembled into a matrix form with rows and columns representing distinct types of information.
The main advantage of 'annmatrix' over BioConductor implementations like SummarizedExperiment and AnnotatedDataFrame is simplicity. Since 'annmatrix' is based on a matrix, and not a list or a data frame, it behaves like a regular matrix and can be directly passed to various methods that expect a matrix for an input.
Demonstration
Say, we have a small gene expression dataset with 10 genes measured across 6 samples.
mat <- matrix(rnorm(10 * 6), nrow = 10, ncol = 6)
[,1] [,2] [,3] [,4] [,5] [,6]
[1,] -0.66184983 -0.3828219 -1.2668148 -1.42199245 -0.431174368 -1.86544873
[2,] 1.71895416 0.2994216 -0.1985833 -0.32822829 0.382446538 1.82998433
[3,] 2.12166699 0.6742398 0.1388658 0.28457007 0.041125095 -0.99111590
[4,] 1.49715368 -0.2928163 -0.2793360 0.71933588 -0.059224001 -1.45043462
[5,] -0.03614058 0.4880534 0.7089194 0.43241598 -1.296423984 -0.01482476
[6,] 1.23194518 0.8828018 -0.7666105 -0.35192477 -2.136976377 0.53663905
[7,] -0.06488077 1.8627490 1.4433629 0.29772143 -0.893614686 -0.81110377
[8,] 1.06899373 1.6117253 0.8448793 -0.26143236 0.612732875 -0.31832480
[9,] -0.37696531 0.1354795 -0.3993704 1.30868973 0.582971232 1.11147600
[10,] 1.04318309 1.0880860 -1.4277676 0.01587026 -0.005882013 -0.14174471
We can turn this matrix into 'annmatrix' object right away.
X <- as.annmatrix(mat)
When printed annmatrix shows 4 first + the last row and 4 first + the last column from the matrix and lists all available row and column annotations (of which there are currently none).
X
[,1] [,2] [,3] [,4] [,6]
[1,] -0.66184983 -0.38282188 -1.26681476 -1.42199245 ........... -1.86544873
[2,] 1.71895416 0.29942160 -0.19858329 -0.32822829 ........... 1.82998433
[3,] 2.12166699 0.67423976 0.13886578 0.28457007 ........... -0.99111590
[4,] 1.49715368 -0.29281632 -0.27933600 0.71933588 ........... -1.45043462
........... ........... ........... ........... ........... ...........
[10,] 1.04318309 1.08808601 -1.42776759 0.01587026 ........... -0.14174471
rann:
cann:
Custom operators @ and $ are provided for convenient manipulation of row and column data.
Let's add some additional information about our samples.
X$group <- c("case", "case", "case", "control", "control", "control")
X$sex <- c("F", "M", "M", "M", "F", "F")
X
[,1] [,2] [,3] [,4] [,6]
[1,] -0.66184983 -0.38282188 -1.26681476 -1.42199245 ........... -1.86544873
[2,] 1.71895416 0.29942160 -0.19858329 -0.32822829 ........... 1.82998433
[3,] 2.12166699 0.67423976 0.13886578 0.28457007 ........... -0.99111590
[4,] 1.49715368 -0.29281632 -0.27933600 0.71933588 ........... -1.45043462
........... ........... ........... ........... ........... ...........
[10,] 1.04318309 1.08808601 -1.42776759 0.01587026 ........... -0.14174471
rann:
cann: group, sex
We can add the entire annotation table by assigning to an empty value. Let's do this for rows.
chromosome <- c("chr1", "chr1", "chr1", "chr1", "chr2", "chr2", "chr2", "chr3", "chr3", "chr3")
position <- runif(10, 0, 1000000)
X@'' <- data.frame(chr = chromosome, pos = position)
X
[,1] [,2] [,3] [,4] [,6]
[1,] -0.66184983 -0.38282188 -1.26681476 -1.42199245 ........... -1.86544873
[2,] 1.71895416 0.29942160 -0.19858329 -0.32822829 ........... 1.82998433
[3,] 2.12166699 0.67423976 0.13886578 0.28457007 ........... -0.99111590
[4,] 1.49715368 -0.29281632 -0.27933600 0.71933588 ........... -1.45043462
........... ........... ........... ........... ........... ...........
[10,] 1.04318309 1.08808601 -1.42776759 0.01587026 ........... -0.14174471
rann: chr, pos
cann: group, sex
Same shortcuts can be used for retrieving available annotations.
X@chr
[1] "chr1" "chr1" "chr1" "chr1" "chr2" "chr2" "chr2" "chr3" "chr3" "chr3"
X$group
[1] "case" "case" "case" "control" "control" "control"
As well as for adjusting annotations.
X@pos
[1] 418638.0 423928.7 248000.4 220840.4 482854.1 662214.0 122708.6 334171.7 219852.3 927672.1
X@pos <- X@pos * 10
X@pos
[1] 4186380 4239287 2480004 2208404 4828541 6622140 1227086 3341717 2198523 9276721
Or create new ones.
X$age <- seq(10, 60, 10)
X$age
[1] 10 20 30 40 50 60
When an empty name is provided it will return the whole annotation data.frame.
X$''
group sex age
1 case F 10
2 case M 20
3 case M 30
4 control M 40
5 control F 50
6 control F 60
When subsetting the annmatrix object all the annotations are correctly adjusted and class is preserved.
X_case <- X[, X$group == "case"]
X_case
[,1] [,2] [,3]
[1,] -0.6618498 -0.3828219 -1.2668148
[2,] 1.7189542 0.2994216 -0.1985833
[3,] 2.1216670 0.6742398 0.1388658
[4,] 1.4971537 -0.2928163 -0.2793360
.......... .......... ..........
[10,] 1.0431831 1.0880860 -1.4277676
rann: chr, pos
cann: group, sex, age
X_case$''
group sex age
1 case F 10
2 case M 20
3 case M 30
However in order to be consistent with matrix the class is dropped when selecting only a single row or column.
X[1,]
[1] -0.6618498 -0.3828219 -1.2668148 -1.4219925 -0.4311744 -1.8654487
But just like with a matrix we can enforce it to preserve all the annotations and the class by setting drop=FALSE.
X[1,, drop=FALSE]
[,1] [,2] [,3] [,4] [,6]
[1,] -0.6618498 -0.3828219 -1.2668148 -1.4219925 .......... -1.8654487
rann: chr, pos
cann: group, sex, age
Operations on annmatrix object don't loose the class.
X > 0
[,1] [,2] [,3] [,4] [,6]
[1,] FALSE FALSE FALSE FALSE ..... FALSE
[2,] TRUE TRUE FALSE FALSE ..... TRUE
[3,] TRUE TRUE TRUE TRUE ..... FALSE
[4,] TRUE FALSE FALSE TRUE ..... FALSE
..... ..... ..... ..... ..... .....
[10,] TRUE TRUE FALSE TRUE ..... FALSE
rann: chr, pos
cann: group, sex, age
X <- X - rowMeans(X)
X
[,1] [,2] [,3] [,4] [,6]
[1,] 0.34316717 0.62219512 -0.26179776 -0.41697545 ........... -0.86043172
[2,] 1.10162165 -0.31791091 -0.81591579 -0.94556080 ........... 1.21265182
[3,] 1.74344169 0.29601446 -0.23935952 -0.09365523 ........... -1.36934120
[4,] 1.47470725 -0.31526276 -0.30178244 0.69688945 ........... -1.47288106
........... ........... ........... ........... ........... ...........
[10,] 0.94789225 0.99279517 -1.52305843 -0.07942058 ........... -0.23703556
rann: chr, pos
cann: group, sex, age
Matrix transpose will preserve the class and correctly adjust row and column annotations.
t(X)
[,1] [,2] [,3] [,4] [,10]
[1,] 0.34316717 1.10162165 1.74344169 1.47470725 ........... 0.94789225
[2,] 0.62219512 -0.31791091 0.29601446 -0.31526276 ........... 0.99279517
[3,] -0.26179776 -0.81591579 -0.23935952 -0.30178244 ........... -1.52305843
[4,] -0.41697545 -0.94556080 -0.09365523 0.69688945 ........... -0.07942058
........... ........... ........... ........... ........... ...........
[6,] -0.86043172 1.21265182 -1.36934120 -1.47288106 ........... -0.23703556
rann: group, sex, age
cann: chr, pos
Principal component analysis with prcomp will transform the PCA loadings into 'annmatrix' object and add row and column annotations to it, such as proportion of variance explained.
pca <- prcomp(t(X))
pca$rotation
PC1 PC2 PC3 PC4 PC6
[1,] 0.17186228 -0.06111446 0.28479933 0.34143265 ........... 0.06141574
[2,] 0.07770596 0.56511346 -0.15143694 0.26206867 ........... -0.05690171
[3,] 0.48808049 0.04486714 0.31834335 -0.16657847 ........... 0.57896252
[4,] 0.34355333 0.02691052 0.45134983 -0.56375589 ........... -0.52045090
........... ........... ........... ........... ........... ...........
[10,] 0.32535557 0.32483324 0.07792832 0.15417554 ........... 0.21093439
rann: chr, pos
cann: pc, sd, var, var_explained
pca$rotation$var_explained
[1] 3.976151e-01 2.492482e-01 1.991826e-01 8.899235e-02 6.496171e-02 3.582514e-33
Furthermore, matrix cross-product will preserve all annotations that are possible to preserve after the product.
X_scores <- t(pca$rotation) %*% X
X_scores
[,1] [,2] [,3] [,4] [,6]
PC1 2.642132e+00 1.845104e+00 -3.957560e-01 -5.252007e-01 ............. -1.828050e+00
PC2 1.486939e+00 -8.303449e-01 -2.172757e+00 -3.843922e-01 ............. 1.723213e+00
PC3 7.210412e-01 -8.182090e-01 -4.038344e-01 1.336113e-01 ............. -1.709567e+00
PC4 -2.734391e-01 8.671400e-01 2.275004e-03 -1.559362e+00 ............. 2.337191e-01
............. ............. ............. ............. ............. .............
PC6 1.110223e-16 2.220446e-15 2.553513e-15 -1.020364e-14 ............. -2.567391e-16
rann: pc, sd, var, var_explained
cann: group, sex, age
X_scores@''
pc sd var var_explained
PC1 PC1 1.853695e+00 3.436186e+00 3.976151e-01
PC2 PC2 1.467652e+00 2.154001e+00 2.492482e-01
PC3 PC3 1.311996e+00 1.721335e+00 1.991826e-01
PC4 PC4 8.769670e-01 7.690712e-01 8.899235e-02
PC5 PC5 7.492653e-01 5.613986e-01 6.496171e-02
PC6 PC6 1.759547e-16 3.096006e-32 3.582514e-33
X_scores$''
group sex age
1 case F 10
2 case M 20
3 case M 30
4 control M 40
5 control F 50
6 control F 60
And, of course, we get all the goodies that come from storing our data as a matrix.
# medians of all genes on chromosome 1
library(matrixStats)
rowMedians(X[X@chr == "chr1",])
[1] 0.04068471 -0.27639844 -0.16650737 -0.19172644
# Gene-wise Bartlett's test for equal variance between cases and control
library(matrixTests)
row_bartlett(X, X$group)
obs.tot obs.groups var.pooled df statistic pvalue
1 6 2 0.3717333 1 0.363202329 0.546733101
2 6 2 1.0998615 1 0.016042378 0.899210686
3 6 2 0.7554444 1 0.268153616 0.604573040
4 6 2 1.1341347 1 0.006848371 0.934046441
5 6 2 0.4758403 1 1.043799502 0.306939452
6 6 2 1.4967384 1 0.093874925 0.759307605
7 6 2 0.7351686 1 0.275875443 0.599417430
8 6 2 0.2139256 1 0.124149137 0.724577269
9 6 2 0.1161703 1 0.073665362 0.786072915
10 6 2 1.0400756 1 6.832203465 0.008952875
# Pearson's correlation test between each gene's expression values and the age of subjects
library(matrixTests)
row_cor_pearson(X, X$age)
obs.paired cor df statistic pvalue conf.low conf.high alternative cor.null conf.level
1 6 -0.5602433 4 -1.35270865 0.24755755 -0.9430338 0.46085636 two.sided 0 0.95
2 6 0.0384372 4 0.07693125 0.94237259 -0.7980176 0.82428560 two.sided 0 0.95
3 6 -0.9092607 4 -4.36906111 0.01197687 -0.9901613 -0.37278589 two.sided 0 0.95
4 6 -0.6950676 4 -1.93357802 0.12529880 -0.9632623 0.26724253 two.sided 0 0.95
5 6 -0.4096758 4 -0.89818427 0.41986507 -0.9165164 0.60205486 two.sided 0 0.95
6 6 -0.5186591 4 -1.21326433 0.29177292 -0.9361660 0.50580928 two.sided 0 0.95
7 6 -0.6143204 4 -1.55710099 0.19443841 -0.9515021 0.39334780 two.sided 0 0.95
8 6 -0.7763522 4 -2.46344001 0.06943424 -0.9741458 0.09517432 two.sided 0 0.95
9 6 0.7663925 4 2.38613079 0.07548443 -0.1194861 0.97285981 two.sided 0 0.95
10 6 -0.4486700 4 -1.00407581 0.37215468 -0.9238398 0.57069431 two.sided 0 0.95
When needed 'annmatrix' can be transformed into a long-format data frame.
stack(X)
value chr pos group sex age
1:1 0.343167174 chr1 4186380 case F 10
2:1 1.101621650 chr1 4239287 case F 10
3:1 1.743441691 chr1 2480004 case F 10
4:1 1.474707248 chr1 2208404 case F 10
5:1 -0.083140482 chr2 4828541 case F 10
6:1 1.332632768 chr2 6622140 case F 10
... ............ .... ....... .... . ..
Which then can be used for things like making ggplot2 figures.
# case vs control boxplot by chromosome
library(ggplot2)
ggplot(stack(X), aes(x=group, y=value, color=group)) +
facet_wrap(~chr) +
geom_boxplot() +
theme_bw()
Technical Details
annmatrix uses R's S3 class system to extend the base matrix class in order to provide it with persistent annotations that are associated with rows and columns.
Technically annmatrix object is just a regular R matrix with additional data.frame attributes .annmatrix.rann and .annmatrix.cann that are preserved after sub-setting and other matrix-specific operations.
As a result, every function that works on a matrix by design should work the same way with annmatrix.
Installation
Directly from CRAN:
install.packages("annmatrix")
Or from GitHub, using remotes library:
remotes::install_github("karoliskoncevicius/annmatrix") # CRAN version
remotes::install_github("karoliskoncevicius/annmatrix@dev") # stable changes not yet on CRAN
See Also
Similar ideas can be found in:
R Package Documentation
Browse R Packages
We want your feedback!
Note that we can't provide technical support on individual packages. You should contact the package authors for that.
Embedding an R snippet on your website
Add the following code to your website.
For more information on customizing the embed code, read Embedding Snippets.