README.md
In KeesVanImmerzeel/hlptabel: Calculate Reduction In Crop Production Caused By Waterlogging And Drought
Title: Package 'hlptabel'
Author: C.H. van Immerzeel
Date: januari 6, 2024
Package "helptabel"


Estimate the reduction in crop production caused by waterlogging and drought using relations documented in [1].
Datasets for the Netherlands characterizing the soils and landuse are included in this package.
The groundwater regime is characterized by the mean (average) lowest and highest groundwaterlevel ("GHG and "GLG").
70 different soil types are distinguished and two types of land use (grassland and arable land).
The following approximate analytical formulas are used to calculate the reduction in crop production.
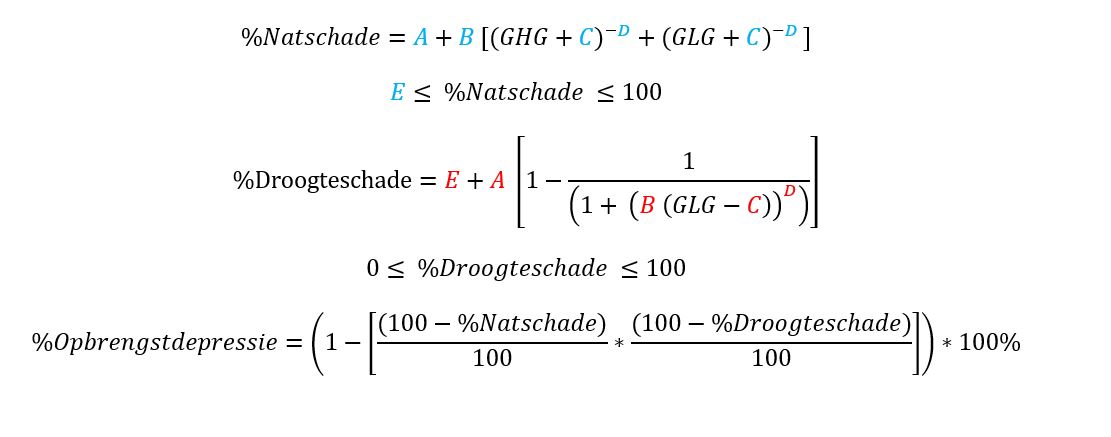
For the calculation of the reduction in crop production caused by waterlogging ("Natschade"), the blue parameters A-D are optimized against the tabulated values in the "HELP-tabel (1987, see below"). In this relation the parameter E equals the smallest tabulated reduction caused by waterlogging (for every soil/crop combination).
For the calculation of the reduction in crop production caused by drought ("Droogteschade"), the red parameters A-E are optimized against the tabulated values in the "HELP-tabel (1987).
The "data-raw" folder contains the "original" (1987) HELP tables, as well as the optimization code.
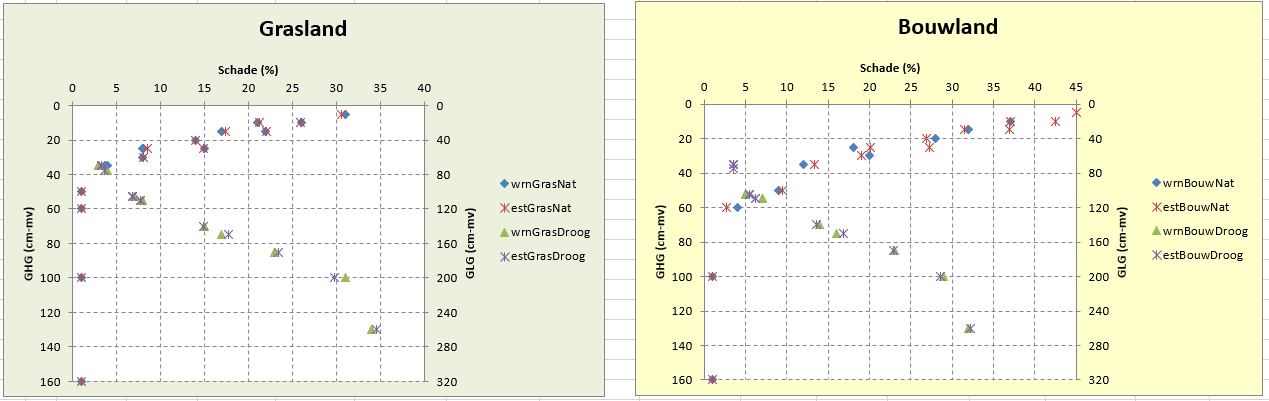
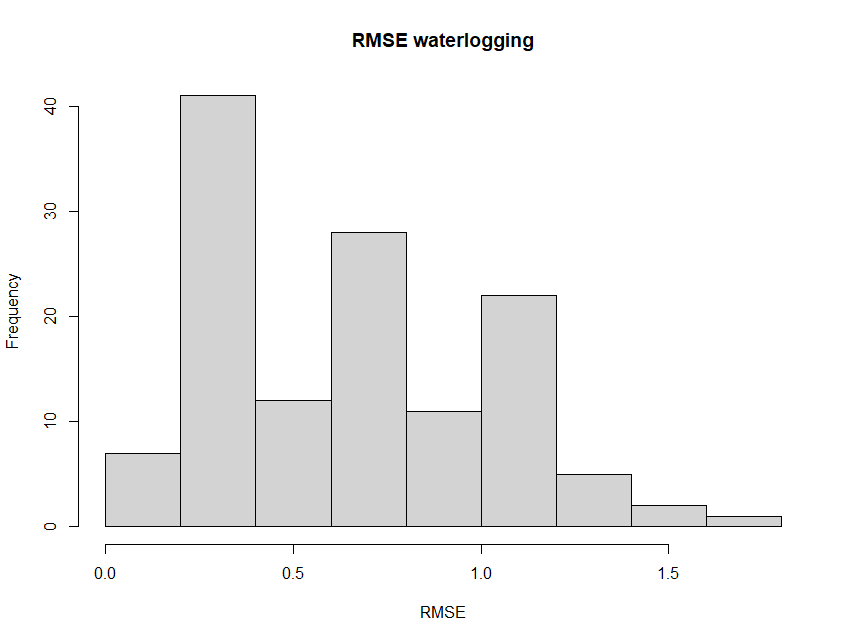
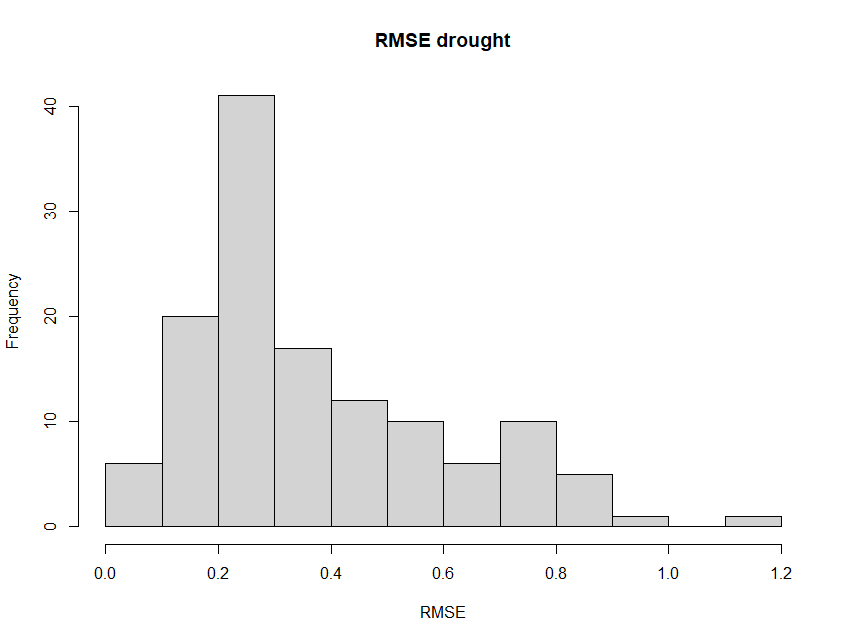
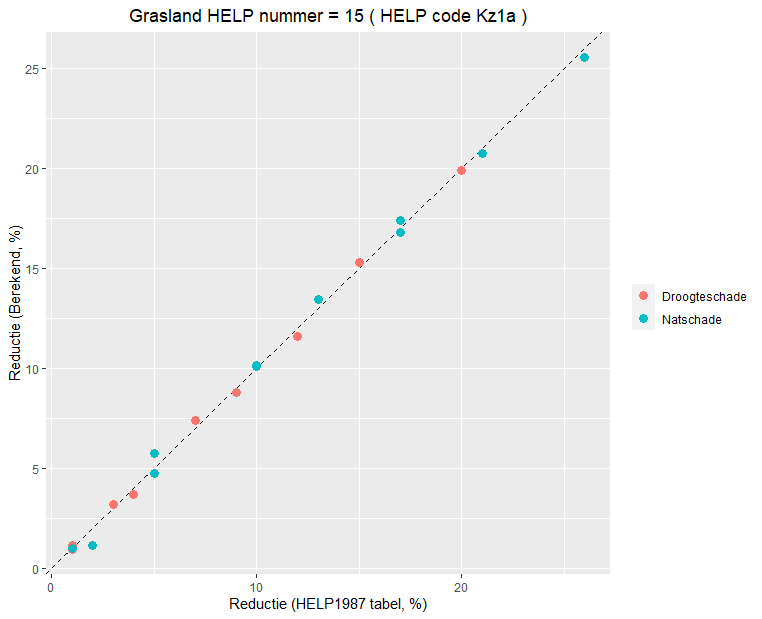
Differences between the values calculated with the above formulas and the tabulated values are typically small. The frequency distributions of the root-mean-square error values illustrate this, as well as the comparison between tabulated and calculated reduction values for the soil HELP=15 (landuse = grassland).
Installation
You can install the released version of menyanthes from with:
install_github("KeesVanImmerzeel/hlptabel")
Then load the package with:
library("hlptabel")
Functions
ht_reduction(): Calculate reduction in crop production caused by waterlogging and drought.ht_reduction_brk(): Calculate reduction in crop production caused by waterlogging and drought using a SpatRaster object as input. A maximum of 8 cores is used for the calculation.ht_tab_calc_values(): Tabulated and calculated reductions in crop production.ht_plot_calc_values(): Plot of tabulated and calculated reductions in crop production.
Datasets
HELP_map_NL2020: Raster map of 1987 HELP codes for the Netherlands, based on the Bofek2020 raster map. Resolution 25x25m.landuse_map_NL2021: Raster map (resolution 25x25m) of landuse (2021) based on the TOP25raster_GEOTIFF dataset 2021.
To use these datasets, the following code can be used:
-
HELP_map_NL2020 <- file.path( find.package("hlptabel"), "extdata", "HELP_map_NL2020.tif") |> terra::rast()
-
landuse_map_NL2021 <- file.path( find.package("hlptabel"), "extdata", "landuse_map_NL2021.tif") |> terra::rast()
Get help
To get help on the functions in this package type a question mark before the function name, like ?ht_reduction()
SpatRaster example.
x <- terra::rast(system.file("extdata","example_spatraster.tif",package="hlptabel"))
r <- ht_reduction_brk(x)
Remarks
In the HELP-table (1987) the HELP numbers 71 and 72 where not included. You might consider to reclassify the HELP numbers 71 and 72 to the most similar soil codes in the HELP-table (1987) (refer [2] page 16). HELP number 71 --> 67; HELP number 72 --> 60. Dataset HELP_map_NL2020 is already converted in this way.
References
-
De invloed van de waterhuishouding op de landbouwkundige produktie
Rapport van de werkgroep HELP-tabel, Mededelingen Landinrichtingsdienst 176 (1987).
-
HELP-2005. stowa rapport 2005/16.
Uitbreiding en actualisering van de HELP-tabellen ten behoeve van het Waternood-instrumentarium.
-
BOFEK2020 – Bodemfysische schematisatie van Nederland; Update bodemfysische eenhedenkaart
Heinen, M., F. Brouwer, K. Teuling, D. Walvoort, 2021. Wageningen Environmental Research.
Rapport 3056
KeesVanImmerzeel/hlptabel documentation built on Jan. 9, 2025, 5:32 p.m.
R Package Documentation
Browse R Packages
We want your feedback!
Note that we can't provide technical support on individual packages. You should contact the package authors for that.
Title: Package 'hlptabel' Author: C.H. van Immerzeel Date: januari 6, 2024
Package "helptabel"
Estimate the reduction in crop production caused by waterlogging and drought using relations documented in [1]. Datasets for the Netherlands characterizing the soils and landuse are included in this package.
The groundwater regime is characterized by the mean (average) lowest and highest groundwaterlevel ("GHG and "GLG"). 70 different soil types are distinguished and two types of land use (grassland and arable land).
The following approximate analytical formulas are used to calculate the reduction in crop production.
For the calculation of the reduction in crop production caused by waterlogging ("Natschade"), the blue parameters A-D are optimized against the tabulated values in the "HELP-tabel (1987, see below"). In this relation the parameter E equals the smallest tabulated reduction caused by waterlogging (for every soil/crop combination).
For the calculation of the reduction in crop production caused by drought ("Droogteschade"), the red parameters A-E are optimized against the tabulated values in the "HELP-tabel (1987).
The "data-raw" folder contains the "original" (1987) HELP tables, as well as the optimization code.
Differences between the values calculated with the above formulas and the tabulated values are typically small. The frequency distributions of the root-mean-square error values illustrate this, as well as the comparison between tabulated and calculated reduction values for the soil HELP=15 (landuse = grassland).
Installation
You can install the released version of menyanthes from with:
install_github("KeesVanImmerzeel/hlptabel")
Then load the package with:
library("hlptabel")
Functions
ht_reduction(): Calculate reduction in crop production caused by waterlogging and drought.ht_reduction_brk(): Calculate reduction in crop production caused by waterlogging and drought using a SpatRaster object as input. A maximum of 8 cores is used for the calculation.ht_tab_calc_values(): Tabulated and calculated reductions in crop production.ht_plot_calc_values(): Plot of tabulated and calculated reductions in crop production.
Datasets
HELP_map_NL2020: Raster map of 1987 HELP codes for the Netherlands, based on the Bofek2020 raster map. Resolution 25x25m.landuse_map_NL2021: Raster map (resolution 25x25m) of landuse (2021) based on the TOP25raster_GEOTIFF dataset 2021.
To use these datasets, the following code can be used:
-
HELP_map_NL2020 <- file.path( find.package("hlptabel"), "extdata", "HELP_map_NL2020.tif") |> terra::rast() -
landuse_map_NL2021 <- file.path( find.package("hlptabel"), "extdata", "landuse_map_NL2021.tif") |> terra::rast()
Get help
To get help on the functions in this package type a question mark before the function name, like ?ht_reduction()
SpatRaster example.
x <- terra::rast(system.file("extdata","example_spatraster.tif",package="hlptabel"))
r <- ht_reduction_brk(x)
Remarks
In the HELP-table (1987) the HELP numbers 71 and 72 where not included. You might consider to reclassify the HELP numbers 71 and 72 to the most similar soil codes in the HELP-table (1987) (refer [2] page 16). HELP number 71 --> 67; HELP number 72 --> 60. Dataset HELP_map_NL2020 is already converted in this way.
References
-
De invloed van de waterhuishouding op de landbouwkundige produktie Rapport van de werkgroep HELP-tabel, Mededelingen Landinrichtingsdienst 176 (1987).
-
HELP-2005. stowa rapport 2005/16. Uitbreiding en actualisering van de HELP-tabellen ten behoeve van het Waternood-instrumentarium.
-
BOFEK2020 – Bodemfysische schematisatie van Nederland; Update bodemfysische eenhedenkaart Heinen, M., F. Brouwer, K. Teuling, D. Walvoort, 2021. Wageningen Environmental Research. Rapport 3056
R Package Documentation
Browse R Packages
We want your feedback!
Note that we can't provide technical support on individual packages. You should contact the package authors for that.
Embedding an R snippet on your website
Add the following code to your website.
For more information on customizing the embed code, read Embedding Snippets.