best_Spatial_CorrStruct: Find the best spatial correlation structure in GLMM run with...
In MarcoPittarello/AnalysisTools: A set of support tools for data analysis
View source: R/best_Spatial_CorrStruct.R
best_Spatial_CorrStruct R Documentation
Find the best spatial correlation structure in GLMM run with 'lme' function in 'nlme' package.
Description
When through the function (modelCheck_plots) spatial autocorrelation is found in the residuals of a model performed
with (gls) or (lme), it may be necessary to specify the structure of this spatial correlation through the 'correlation' argument.
Among the different correlation structures (see (CorStruct)), those supported by the present function are:
corGaus –> Gaussian spatial correlation
corExp –> Exponential spatial correlation
corSpher –> Spherical spatial correlation
corLin –> Linear spatial correlation.
See @examples section for operative details
Usage
best_Spatial_CorrStruct(
  data,
  X,
  Y,
  var.res,
  range,
  sill,
  nugget,
  spatial.formula
)
Arguments
data
a data.frame used as data input in the model
X
column within the dataset containing the coordinates X (e.g.: dataset$X)
Y
column within the dataset containing the coordinates Y (e.g.: dataset$Y)
var.res
column within the dataset containing the response variable or model residuals obtained with residuals(model,type="pearson") see @examples
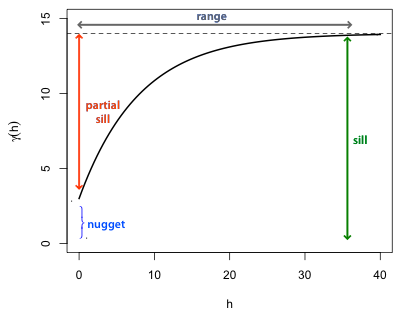
range
value of the 'range' identifiable from the semivariogram obtained with (modelCheck_plots).
sill
value of the 'sill' identifiable from the semivariogram obtained with (modelCheck_plots).
nugget
value of the 'nugget' identifiable from the semivariogram obtained with (modelCheck_plots).
spatial.formula
a one sided formula of the form ~ S1+...+Sp, or ~ S1+...+Sp | g, specifying spatial covariates S1 through Sp and, optionally, a grouping factor g. For more details see the 'form' argument of e.g. (corGaus).
Value
Linear, exponential, gaussian and spherical models plotted on the semivariogram.
It is also provided in the console the string to copy and paste in 'correlation' argument in the functions: (gls), (lme) of 'nlme' package"
References
Gałecki, A., & Burzykowski, T. (2013). Linear mixed-effects model. In Linear mixed-effects models using R (pp. 245-273). Springer, New York, NY.
-
Jack Weiss tutorial (2012). Fitting theoretical models to the empirical semivariogram
Examples
1- define from (modelCheck_plots) which are the values of range, sill, and nugget.
For a definition of range, sill, and nugget terminology see here


2- run 'best_Spatial_CorrStruct' function:
best_Spatial_CorrStruct(data=Dataset,
X = Dataset$X,
Y = Dataset$Y,
var.res = residuals(model,type="pearson"),
range = 5,
sill = 5,
nugget = 4,
spatial.formula = "~ X + Y")
MarcoPittarello/AnalysisTools documentation built on Nov. 4, 2022, 7:35 p.m.
R Package Documentation
Browse R Packages
We want your feedback!
Note that we can't provide technical support on individual packages. You should contact the package authors for that.
View source: R/best_Spatial_CorrStruct.R
| best_Spatial_CorrStruct | R Documentation |
Find the best spatial correlation structure in GLMM run with 'lme' function in 'nlme' package.
Description
When through the function (modelCheck_plots) spatial autocorrelation is found in the residuals of a model performed
with (gls) or (lme), it may be necessary to specify the structure of this spatial correlation through the 'correlation' argument.
Among the different correlation structures (see (CorStruct)), those supported by the present function are:
corGaus –> Gaussian spatial correlation
corExp –> Exponential spatial correlation
corSpher –> Spherical spatial correlation
corLin –> Linear spatial correlation.
See @examples section for operative details
Usage
best_Spatial_CorrStruct( data, X, Y, var.res, range, sill, nugget, spatial.formula )
Arguments
data |
a data.frame used as data input in the model |
X |
column within the dataset containing the coordinates X (e.g.: dataset$X) |
Y |
column within the dataset containing the coordinates Y (e.g.: dataset$Y) |
var.res |
column within the dataset containing the response variable or model residuals obtained with residuals(model,type="pearson") see @examples |
range |
value of the 'range' identifiable from the semivariogram obtained with (modelCheck_plots). |
sill |
value of the 'sill' identifiable from the semivariogram obtained with (modelCheck_plots). |
nugget |
value of the 'nugget' identifiable from the semivariogram obtained with (modelCheck_plots). |
spatial.formula |
a one sided formula of the form ~ S1+...+Sp, or ~ S1+...+Sp | g, specifying spatial covariates S1 through Sp and, optionally, a grouping factor g. For more details see the 'form' argument of e.g. (corGaus). |
Value
Linear, exponential, gaussian and spherical models plotted on the semivariogram.
It is also provided in the console the string to copy and paste in 'correlation' argument in the functions: (gls), (lme) of 'nlme' package"
References
Gałecki, A., & Burzykowski, T. (2013). Linear mixed-effects model. In Linear mixed-effects models using R (pp. 245-273). Springer, New York, NY.
-
Jack Weiss tutorial (2012). Fitting theoretical models to the empirical semivariogram
Examples
1- define from (modelCheck_plots) which are the values of range, sill, and nugget. For a definition of range, sill, and nugget terminology see here
2- run 'best_Spatial_CorrStruct' function: best_Spatial_CorrStruct(data=Dataset, X = Dataset$X, Y = Dataset$Y, var.res = residuals(model,type="pearson"), range = 5, sill = 5, nugget = 4, spatial.formula = "~ X + Y")
R Package Documentation
Browse R Packages
We want your feedback!
Note that we can't provide technical support on individual packages. You should contact the package authors for that.
Embedding an R snippet on your website
Add the following code to your website.
For more information on customizing the embed code, read Embedding Snippets.