In NWCEd/NWCEd: National Water Census Education Demo
knitr::opts_chunk$set(echo = TRUE)
fig_caption=TRUE
Introduction
The United States Geological Survey (USGS) has developed a website called the National Water Census Data Portal (NWC-DP). This website allows users to access unprecedented amounts of hydrologic data including precipitation, evapotranspiration (ET), and stream flow datasets. Accompanying the available datasets are tools in the portal which can be used to plot and analyze desired datasets associated with delineated watersheds. The tool which will be explored in the following exercise is the Water Budget tool.
Important Questions to Ask Yourself
- What is the purpose of the NWC-DP?
- What type of data am I working with?
- How are the datasets compiled?
Useful Terms and Acronyms
Term | Definition
------------ | ---------------------------------------------------
NWC-DP | National Water Census Data Portal
HUC | Hydrologic Unit Code which identifies a watershed
Watershed | An area or ridge of land that separates waters flowing to different rivers, basins, or seas
ET | Evapotranspiration - water transferred to the atmosphere through evaporation from soil and transpiration from plants
Exercise 1
Step 1
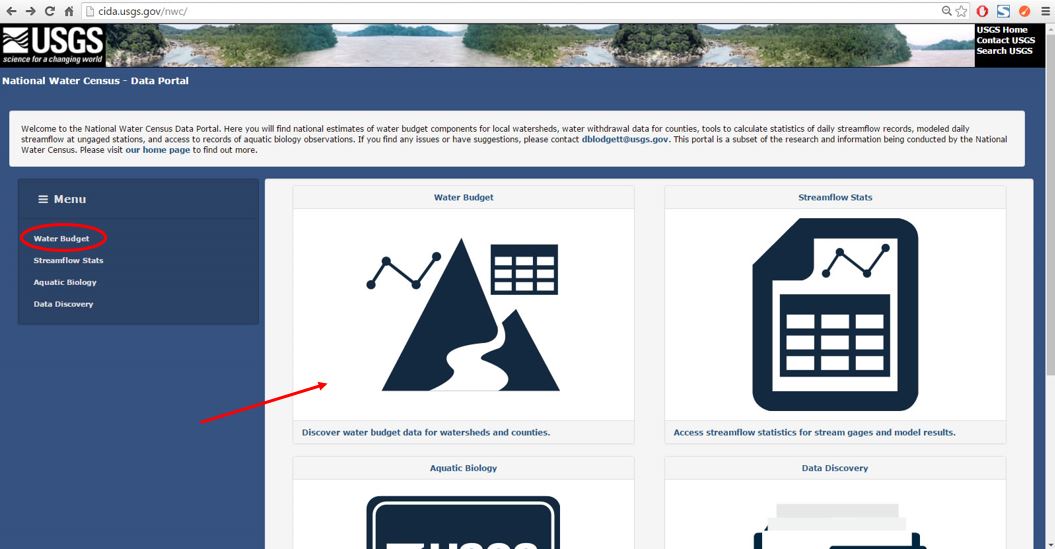
The purpose of Exercise 1 is to walk through the functionality of the Water Budget tool found in the NWC-DP. To access the portal, log on to https://cida.usgs.gov/nwc/. The homepage should look like Figure 1 below. Click on the tab titled, "Water Budget" in the Menu ribbon on the left of the page or anywhere in the large Water Budget icon to access the Water Budget tool.
Step 2
After selecting the Water Budget tool, a new page will open as shown in Figure 2 below. A stream gage layer is displayed in blue on the map. Streams highlighed in a bold blue color are streams for which hydrologic data is available. Use the scroll wheel on the mouse to zoom in to the map to reveal more highlighed streams. You can also click on the Zoom button and then click on desired locations on the map to zoom in. To pan the map view, click the Select button. Then click in the map area and while holding the mouse click and drag the mouse. You can also select the Pan button, click on the map, and drag the cursor while holding the mouse click.
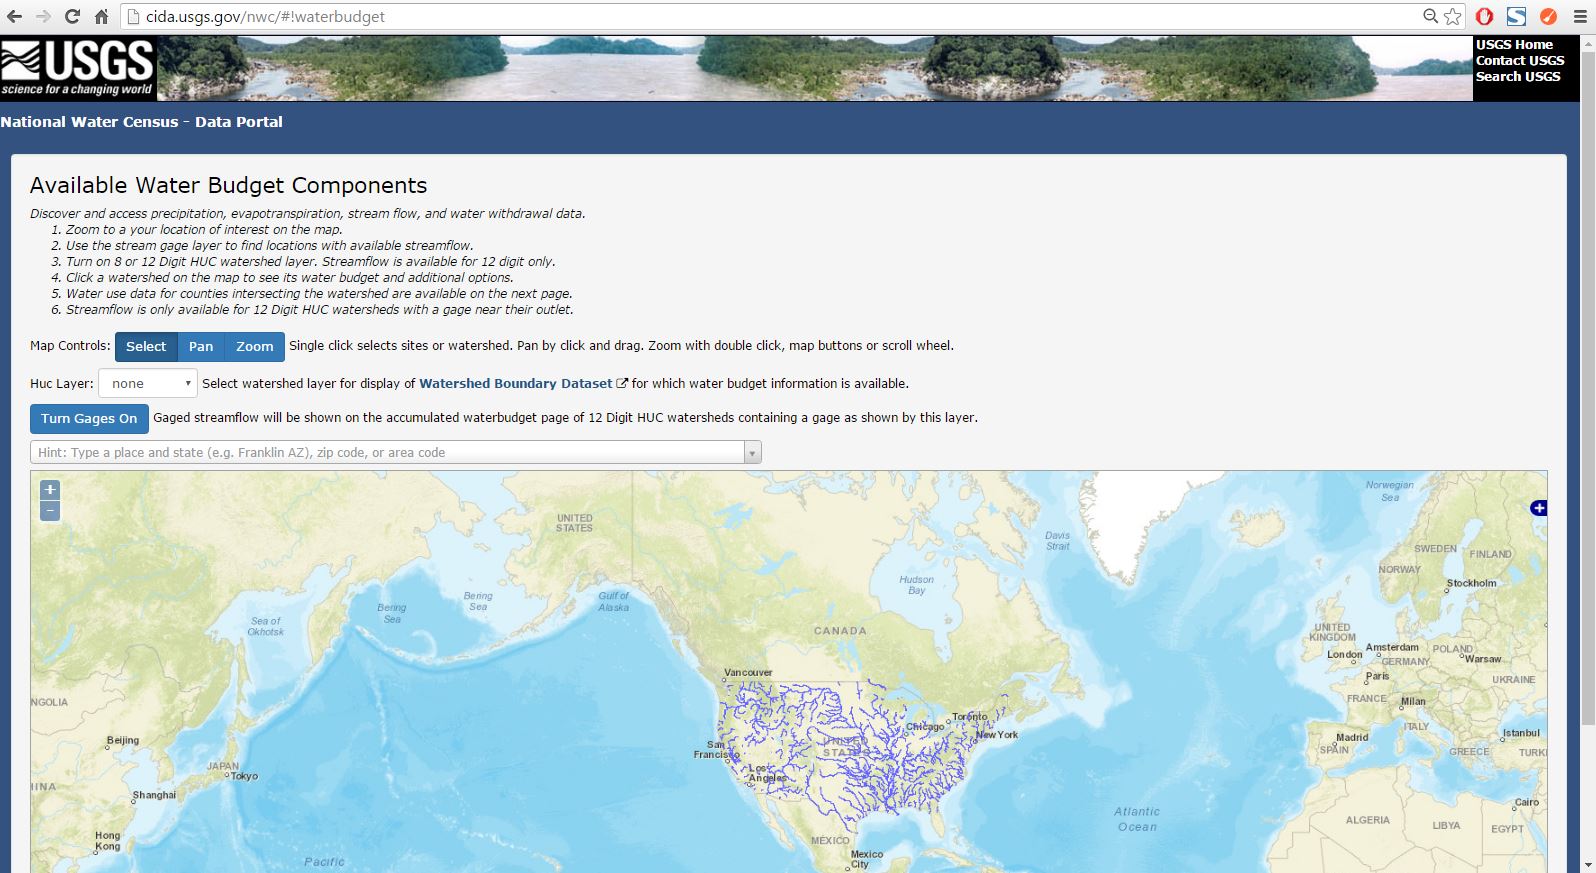
The Turn Gages On button toggles available stream gages on and off. The stream gage sites are locations where flow is measured for the respective stream or river. Streamflow is necessary for determining and managing storage. For more information on how streamflow is measured, please visit https://water.usgs.gov/edu/measureflow.html.
The continental United States has been subdivided into 8-digit and 12-digit HUC watersheds. A HUC is a hydrologic unit code. Each delineated watershed is assigned a HUC ID. Zoom to your hometown or search for it in the search bar below the Turn Gages On button. Click in the Huc Layer: dropdown box and select 8 Digit for the watershed layer. You may need to zoom out to see the black-outlined 8-digit HUC watersheds. Observe the different watersheds displayed. Now select 12 Digit in the Huc Layer: dropdown box.


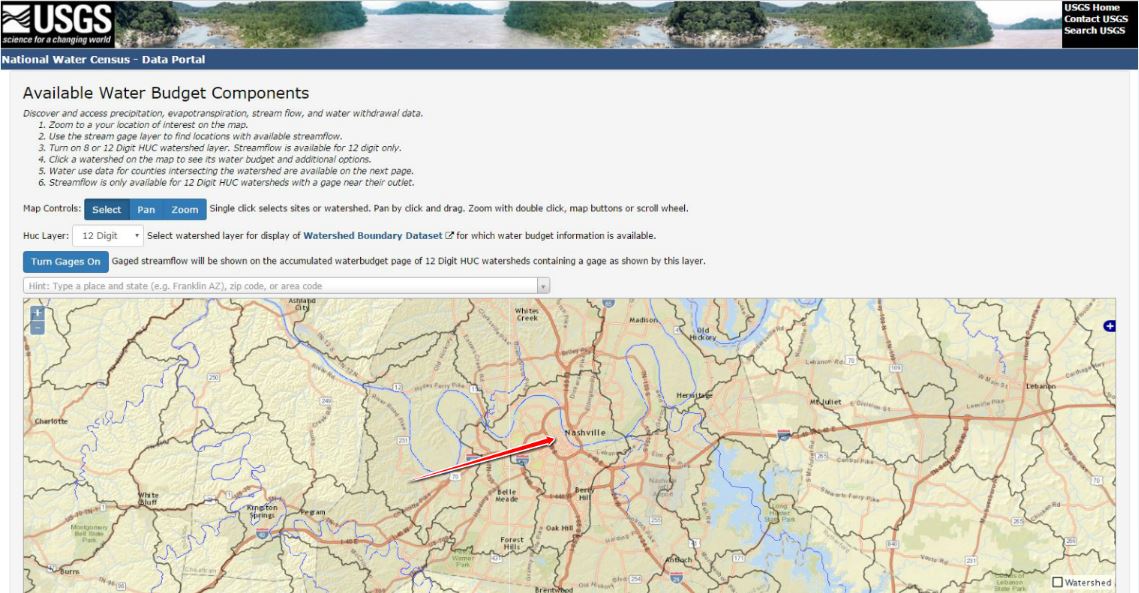
Given Figure 3 and Figure 4, what do you think is the difference between the 8 Digit HUC and the 12 Digit HUC? Set the **`Huc Layer:`** to **12 Digit**. Pan the map to find the 12 Digit HUC which contains Nashville, Tennessee as shown in **Figure 5** below.
Make sure the Select button is selected first and click anywhere inside the boundary of the HUC which contains Nashville, Tennessee. After clicking within the desired HUC boundary, a new page will load showing a monthly time series of area weighted mean precipitation data and area weighted mean actual evapotranspiration data as shown in Figure 6-a and Figure 6-b. Subsequent labs will go into more detail regarding the attributes of the data.
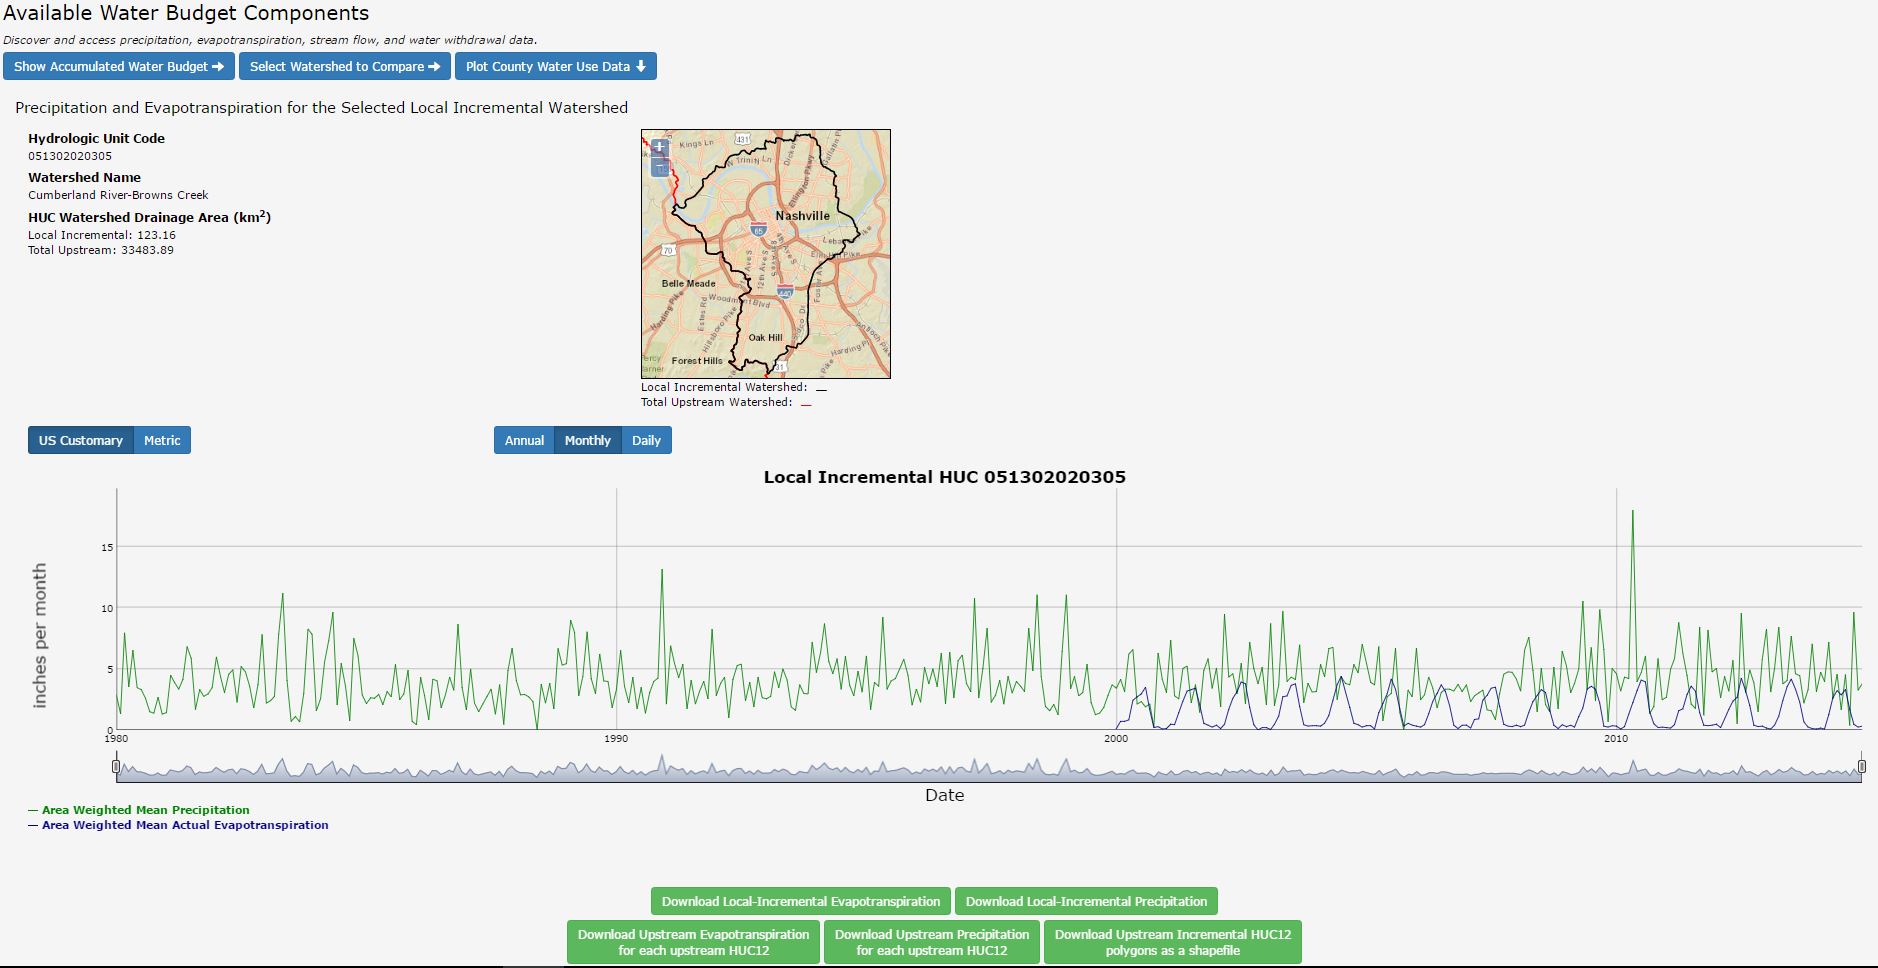

The HUC number, watershed name, and HUC watershed drainage area are shown in the upper left corner of the screen. In the middle of the screen is a map showing the selected HUC watershed. Looking closely at the map shows a red-highlighted line in the upper left corner of the map. Click on the map and while holding the click, drag the mouse to pan the map view. Use the scroll wheel on the mouse to zoom in and out. You will notice that the red highlighted area is of the accumulated watershed area.
#### Step 3
Notice at the top left corner of the screen are the buttons **`Show Accumulated Water Budget`**, **`Select Watershed to Compare`**, and **`Plot County Water Use Data`**. Click on the **`Show Accumulated Water Budget`**. Precipitation, evaporation, and streamflow monthly time series datasets are plotted below as shown in **Figure 7-a** and **Figure 7-b**.
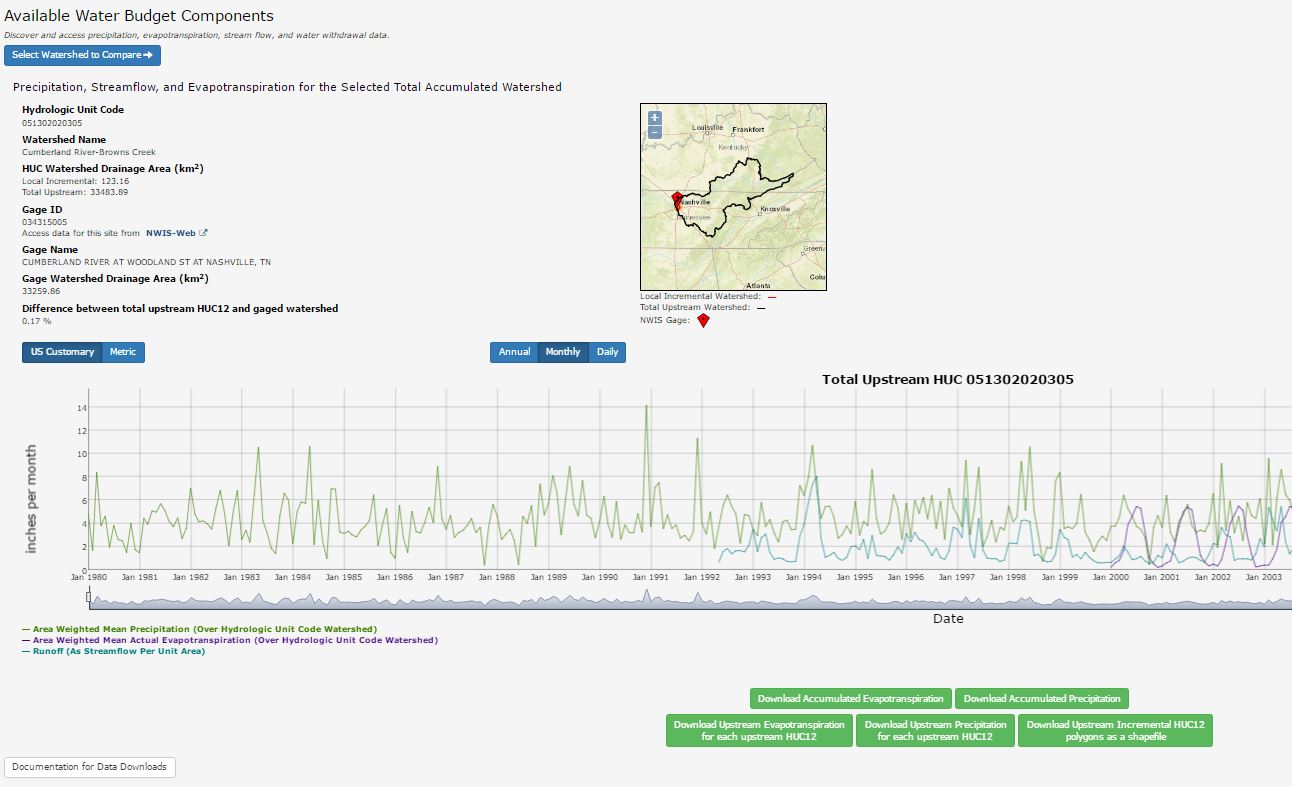

The streamflow is measured using a NWIS gage. The gage location is represented on the map with a red diamond with a black dot in the center. On the left of the screen, information about the selected HUC including HUC number, watershed name, and drainage area is displayed. What is the gage name for this selected HUC? What is the HUC watershed drainage area? What is the gage watershed drainage area? Are they the same? If they are not the same, what would cause them to be different?
Notice the Annual, Monthly, and Daily buttons toward the lower-left corner of the screen . Clicking on any of these buttons automatically adjusts the plots to the respective time series type.
Click the Daily button. How would you describe the difference between the appearance of the Daily and Monthly time series plots? Move your cursor over the plot. Actual data points from each of the respective datasets are displayed under the plot.
Step 4
Click the Select Watershed to Compare button at the top of the page. This function allows users to compare their selected HUC watershed with other HUC watersheds of the same digit type. Using the search bar, search for "Dallas County TX."


What differences do you see between the Cumberland River-Browns Creek watershed (encompassing Nashville, TN) and Headwaters Turtle Creek watershed (encompassing Dallas, TX)?
#### Step 5
Click back 2 times until you return to the page titled "Available Water Budget Components" as shown in **Figure 6-a**. Click on the **`Plot County Water Use Data`**. A new page is loaded which is shown in **Figure 10** below.

In the upper map, the boundary with green fill is the 12 Digit HUC we selected. The boundary with orange fill represents the local county. As shown below the upper map, the entire 12 Digit HUC is found within the county boundary. It makes up 9% of the county area.
Click within the county boundary on the map. A new page will open displaying water usage in Davidson County. This page is shown as **Figure 11** below.

Hovering the cursor over the plotted data activates a popup which displays information regarding the data. The water-use dataset as well as all other datasets can be downloaded by clicking on their respective buttons throughout the pages which have been visited during this exercise.
Try It Yourself
Problem 1
What is a HUC? (_Hint: visit water.usgs.gov/GIS/huc.html_)
#### Problem 2
Using the NWC-DP, find the 12 Digit HUC ID for the HUC that contains Silver City, New Mexico.
What is the name of the watershed?
#### Problem 3
What are the units of ET in the raw data associated with the HUC ID from **Problem 2**? (_Hint: Download the ET data and open the dataset in Excel._)
NWCEd/NWCEd documentation built on May 7, 2019, 6:04 p.m.
R Package Documentation
Browse R Packages
We want your feedback!
Note that we can't provide technical support on individual packages. You should contact the package authors for that.
Embedding an R snippet on your website
Add the following code to your website.
For more information on customizing the embed code, read Embedding Snippets.
knitr::opts_chunk$set(echo = TRUE) fig_caption=TRUE
Introduction
The United States Geological Survey (USGS) has developed a website called the National Water Census Data Portal (NWC-DP). This website allows users to access unprecedented amounts of hydrologic data including precipitation, evapotranspiration (ET), and stream flow datasets. Accompanying the available datasets are tools in the portal which can be used to plot and analyze desired datasets associated with delineated watersheds. The tool which will be explored in the following exercise is the Water Budget tool.
Important Questions to Ask Yourself
- What is the purpose of the NWC-DP?
- What type of data am I working with?
- How are the datasets compiled?
Useful Terms and Acronyms
Term | Definition ------------ | --------------------------------------------------- NWC-DP | National Water Census Data Portal HUC | Hydrologic Unit Code which identifies a watershed Watershed | An area or ridge of land that separates waters flowing to different rivers, basins, or seas ET | Evapotranspiration - water transferred to the atmosphere through evaporation from soil and transpiration from plants
Exercise 1
Step 1
The purpose of Exercise 1 is to walk through the functionality of the
Water Budget tool found in the NWC-DP. To access the portal, log on to https://cida.usgs.gov/nwc/. The homepage should look like Figure 1 below. Click on the tab titled, "Water Budget" in the Menu ribbon on the left of the page or anywhere in the large Water Budget icon to access the Water Budget tool.
Step 2
After selecting the Water Budget tool, a new page will open as shown in Figure 2 below. A stream gage layer is displayed in blue on the map. Streams highlighed in a bold blue color are streams for which hydrologic data is available. Use the scroll wheel on the mouse to zoom in to the map to reveal more highlighed streams. You can also click on the
Zoom button and then click on desired locations on the map to zoom in. To pan the map view, click the Select button. Then click in the map area and while holding the mouse click and drag the mouse. You can also select the Pan button, click on the map, and drag the cursor while holding the mouse click.
The
Turn Gages On button toggles available stream gages on and off. The stream gage sites are locations where flow is measured for the respective stream or river. Streamflow is necessary for determining and managing storage. For more information on how streamflow is measured, please visit https://water.usgs.gov/edu/measureflow.html.
The continental United States has been subdivided into 8-digit and 12-digit HUC watersheds. A HUC is a hydrologic unit code. Each delineated watershed is assigned a HUC ID. Zoom to your hometown or search for it in the search bar below the Turn Gages On button. Click in the Huc Layer: dropdown box and select 8 Digit for the watershed layer. You may need to zoom out to see the black-outlined 8-digit HUC watersheds. Observe the different watersheds displayed. Now select 12 Digit in the Huc Layer: dropdown box.


Given Figure 3 and Figure 4, what do you think is the difference between the 8 Digit HUC and the 12 Digit HUC? Set the **`Huc Layer:`** to **12 Digit**. Pan the map to find the 12 Digit HUC which contains Nashville, Tennessee as shown in **Figure 5** below.
Make sure the
Select button is selected first and click anywhere inside the boundary of the HUC which contains Nashville, Tennessee. After clicking within the desired HUC boundary, a new page will load showing a monthly time series of area weighted mean precipitation data and area weighted mean actual evapotranspiration data as shown in Figure 6-a and Figure 6-b. Subsequent labs will go into more detail regarding the attributes of the data.

The HUC number, watershed name, and HUC watershed drainage area are shown in the upper left corner of the screen. In the middle of the screen is a map showing the selected HUC watershed. Looking closely at the map shows a red-highlighted line in the upper left corner of the map. Click on the map and while holding the click, drag the mouse to pan the map view. Use the scroll wheel on the mouse to zoom in and out. You will notice that the red highlighted area is of the accumulated watershed area.
#### Step 3 Notice at the top left corner of the screen are the buttons **`Show Accumulated Water Budget`**, **`Select Watershed to Compare`**, and **`Plot County Water Use Data`**. Click on the **`Show Accumulated Water Budget`**. Precipitation, evaporation, and streamflow monthly time series datasets are plotted below as shown in **Figure 7-a** and **Figure 7-b**.

The streamflow is measured using a NWIS gage. The gage location is represented on the map with a red diamond with a black dot in the center. On the left of the screen, information about the selected HUC including HUC number, watershed name, and drainage area is displayed. What is the gage name for this selected HUC? What is the HUC watershed drainage area? What is the gage watershed drainage area? Are they the same? If they are not the same, what would cause them to be different?
Notice the Annual, Monthly, and Daily buttons toward the lower-left corner of the screen . Clicking on any of these buttons automatically adjusts the plots to the respective time series type.
Click the Daily button. How would you describe the difference between the appearance of the Daily and Monthly time series plots? Move your cursor over the plot. Actual data points from each of the respective datasets are displayed under the plot.
Step 4
Click the Select Watershed to Compare button at the top of the page. This function allows users to compare their selected HUC watershed with other HUC watersheds of the same digit type. Using the search bar, search for "Dallas County TX."


What differences do you see between the Cumberland River-Browns Creek watershed (encompassing Nashville, TN) and Headwaters Turtle Creek watershed (encompassing Dallas, TX)?
#### Step 5 Click back 2 times until you return to the page titled "Available Water Budget Components" as shown in **Figure 6-a**. Click on the **`Plot County Water Use Data`**. A new page is loaded which is shown in **Figure 10** below.

In the upper map, the boundary with green fill is the 12 Digit HUC we selected. The boundary with orange fill represents the local county. As shown below the upper map, the entire 12 Digit HUC is found within the county boundary. It makes up 9% of the county area. Click within the county boundary on the map. A new page will open displaying water usage in Davidson County. This page is shown as **Figure 11** below.

Hovering the cursor over the plotted data activates a popup which displays information regarding the data. The water-use dataset as well as all other datasets can be downloaded by clicking on their respective buttons throughout the pages which have been visited during this exercise.
Try It Yourself
Problem 1
What is a HUC? (_Hint: visit water.usgs.gov/GIS/huc.html_)
#### Problem 2 Using the NWC-DP, find the 12 Digit HUC ID for the HUC that contains Silver City, New Mexico.
What is the name of the watershed?
#### Problem 3 What are the units of ET in the raw data associated with the HUC ID from **Problem 2**? (_Hint: Download the ET data and open the dataset in Excel._)
NWCEd/NWCEd documentation built on May 7, 2019, 6:04 p.m.
#### Problem 2 Using the NWC-DP, find the 12 Digit HUC ID for the HUC that contains Silver City, New Mexico.
What is the name of the watershed?
#### Problem 3 What are the units of ET in the raw data associated with the HUC ID from **Problem 2**? (_Hint: Download the ET data and open the dataset in Excel._)
R Package Documentation
Browse R Packages
We want your feedback!
Note that we can't provide technical support on individual packages. You should contact the package authors for that.
Embedding an R snippet on your website
Add the following code to your website.
For more information on customizing the embed code, read Embedding Snippets.