README.md
In NYCPlanning/multivariate-dot-density:
labs-multivariate-dot-density
R script for creating multivariate dot density data.
Installation
install.packages('devtools')
install_github('nycplanning/multivariate-dot-density')
Function
generate_dots(
  "data/tracts/region_censustract_v0/region_censustract_v0.shp", # path to spatial data file, could be shape or geojson
  c('EmOff15', 'EmIns15', 'EmInd15', 'EmSer15', 'EmOth15'), # exactly case-sensitive names of columns used for multivariate
  100 # per-dot population factor
)
This will assume the presence of a single polygon geometry column on the input dataset. The second integer determines the number of dots for each population.
About
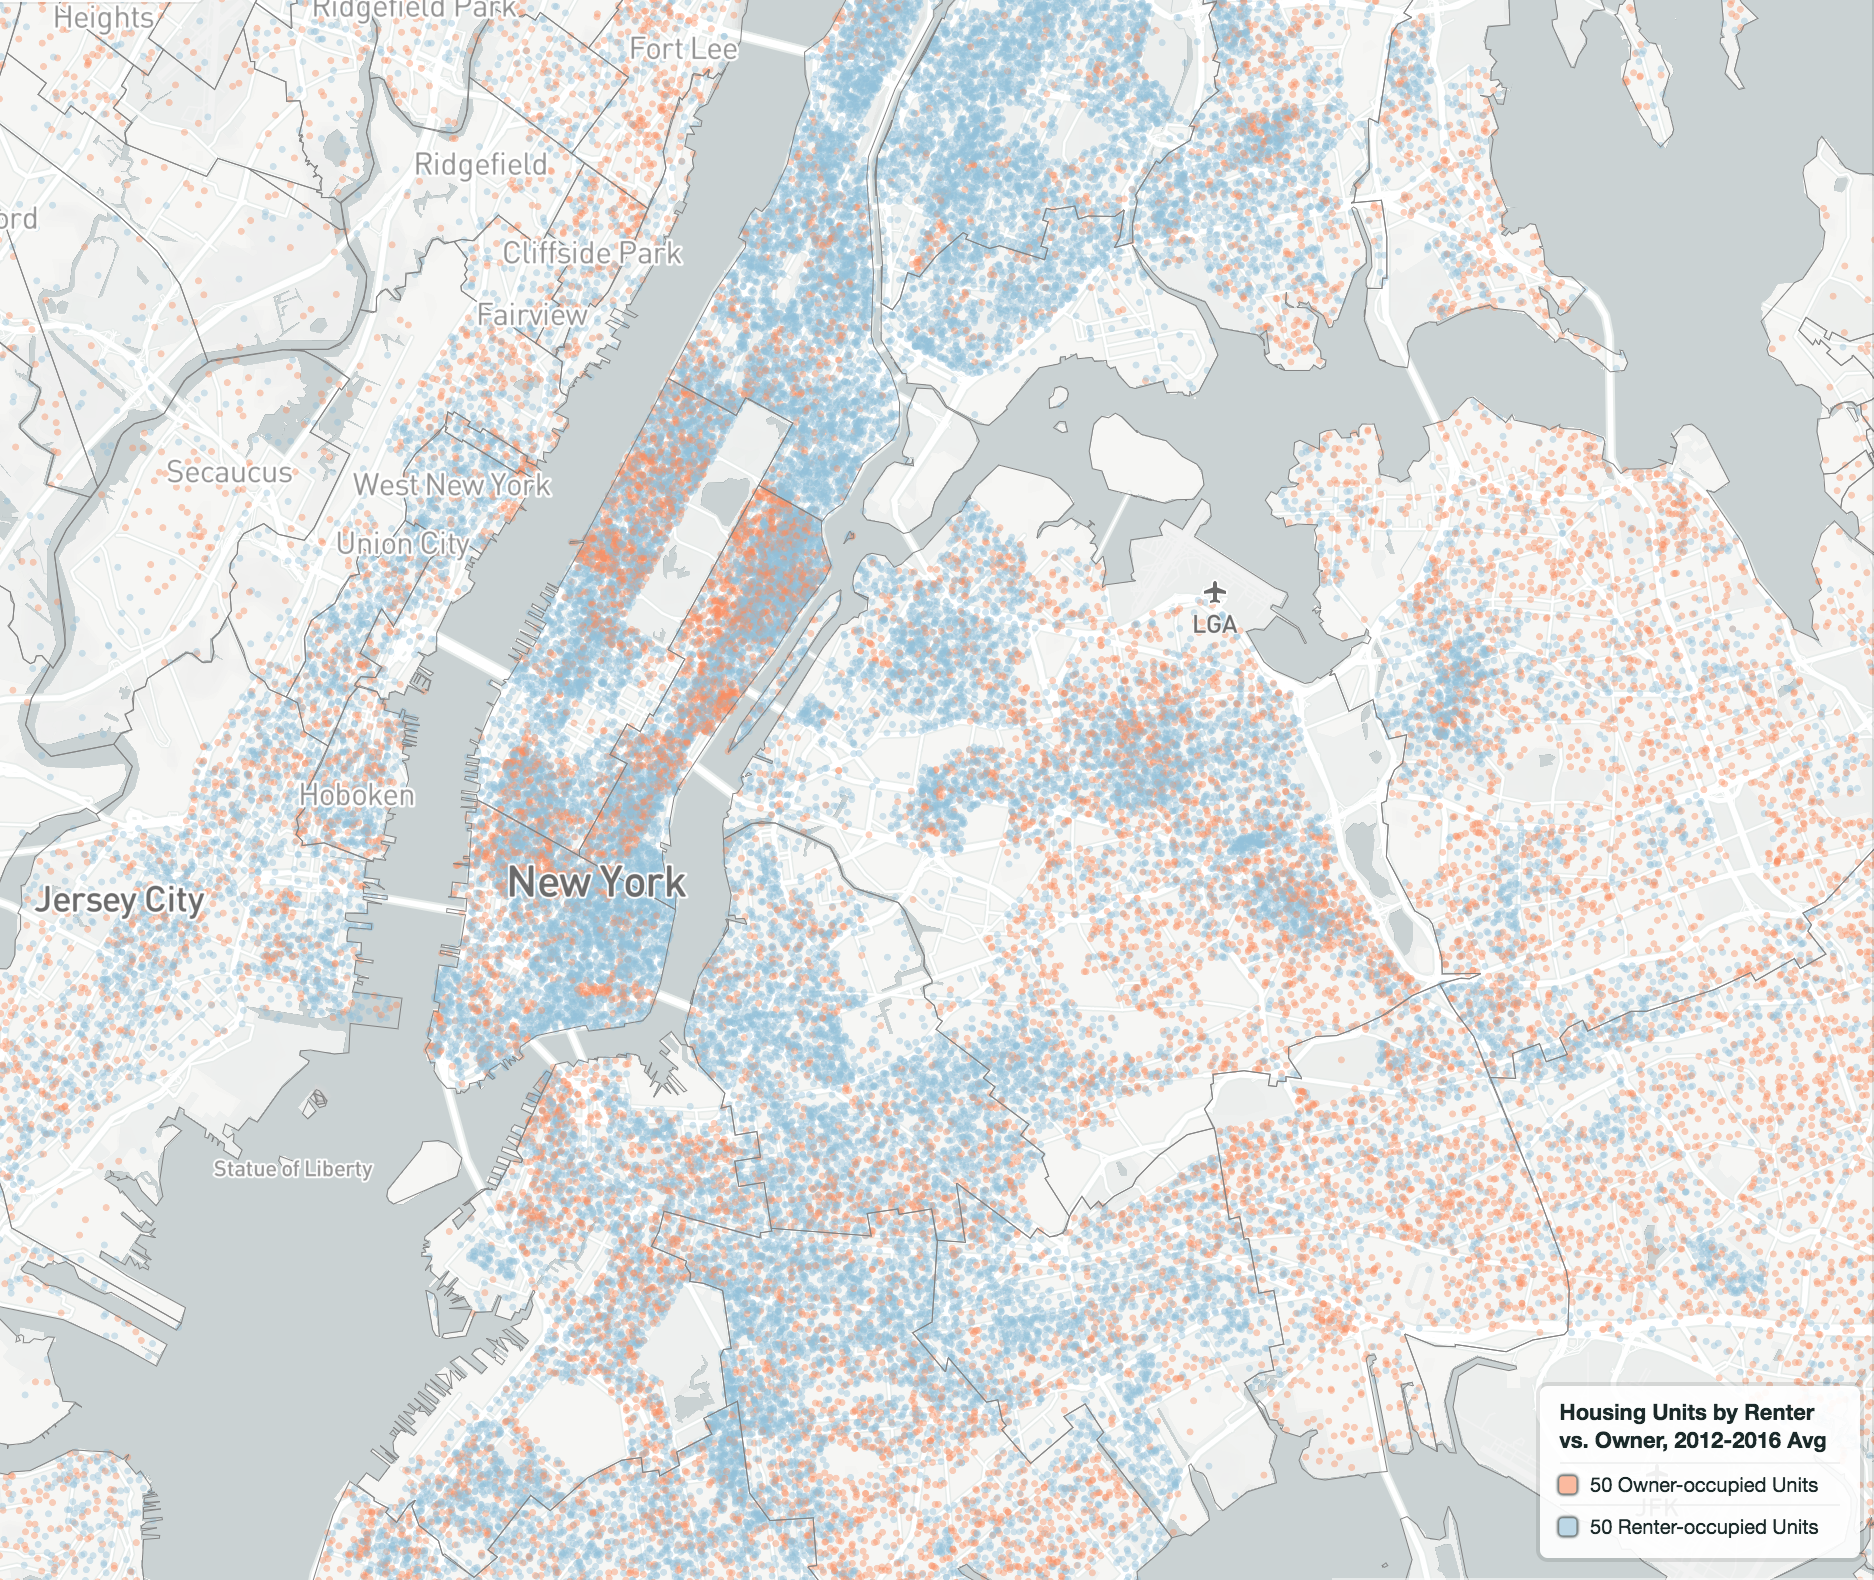
The DCP Metro Mapper includes a number of multivariate dot density maps. The challenge with multivariate dot density is the need for performing additional data manipulation before and especially after random dots are distributed. Doing this alone in SQL requires specific knowledge about which database version you're using, and doing data manipulation in desktop GIS is clunky and error-prone. This script streamlines the process into a single function.
NYCPlanning/multivariate-dot-density documentation built on May 25, 2019, 12:25 p.m.
R Package Documentation
Browse R Packages
We want your feedback!
Note that we can't provide technical support on individual packages. You should contact the package authors for that.
labs-multivariate-dot-density
R script for creating multivariate dot density data.
Installation
install.packages('devtools')
install_github('nycplanning/multivariate-dot-density')
Function
generate_dots(
"data/tracts/region_censustract_v0/region_censustract_v0.shp", # path to spatial data file, could be shape or geojson
c('EmOff15', 'EmIns15', 'EmInd15', 'EmSer15', 'EmOth15'), # exactly case-sensitive names of columns used for multivariate
100 # per-dot population factor
)
This will assume the presence of a single polygon geometry column on the input dataset. The second integer determines the number of dots for each population.
About
The DCP Metro Mapper includes a number of multivariate dot density maps. The challenge with multivariate dot density is the need for performing additional data manipulation before and especially after random dots are distributed. Doing this alone in SQL requires specific knowledge about which database version you're using, and doing data manipulation in desktop GIS is clunky and error-prone. This script streamlines the process into a single function.
R Package Documentation
Browse R Packages
We want your feedback!
Note that we can't provide technical support on individual packages. You should contact the package authors for that.
Embedding an R snippet on your website
Add the following code to your website.
For more information on customizing the embed code, read Embedding Snippets.