README.md
In NathalyDM/Final-Project-Biostat: Introduction to Design Experiments
Final-Project-Biostat
How to install
R package with utility functions to help with data analysis
you can install this through use devtools:
devtools::install_github("NathalyDM/Final-Project-Biostat", upgrade_dependencies = FALSE)
Packages required
library(ggplot2)
library(tidyverse)
library(rstatix)
library(ggpubr)
library(scales)
library(ggsci)
library(flextable)
library(BiostatSupBiotech)
Boxline plot Function
#Change the path of the file
data <- read.csv("data.csv", header=TRUE, sep=";") # Load the data, modify function if required
colnames(data)[1]<-c('ID')
data
data$Rotor.length_c<- factor(data$Rotor.length,labels=c(-1,0,1))
data$Base.length_c<- factor(data$Base.length,labels=c(-1,0,1))
data$Base.width_c<- factor(data$Base.width,labels=c(-1,0,1))
data
summary(data$Time[data$ID==1])
data$ID_c<-as.factor(rep(1:10,3))
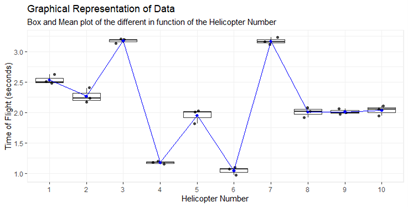
boxline.plot(data,data$ID_c,data$Time,'Helicopter Number','Time of Flight (seconds)',"Box and Mean plot of the different in function of the Helicopter Number", "Graphical Representation of Data")
One factor Plot Function
Mean.Rotor.length<-by(data$Time,data$Rotor.length_c,mean)
Mean.Base_Length<-by(data$Time,data$Base.length_c,mean)
Mean.Base_Width<-by(data$Time,data$Base.width_c,mean)
data$Rep<-as.factor(as.integer(data$Repetition))
data$Rotor.length_c2<- factor(data$Rotor.length_c,labels=c(-1,1), exclude = 0)
data$Base.length_c2<- factor(data$Base.length_c,labels=c(-1,1), exclude = 0)
data$Base.width_c2<- factor(data$Base.width_c,labels=c(-1,1), exclude = 0)
data2<-na.omit(data)
data2$Repetition<-as.factor(data2$Repetition)
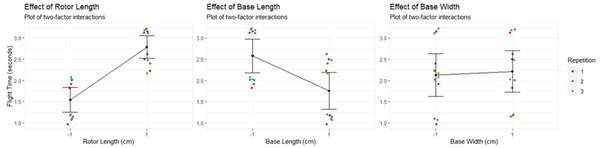
onefactor.plot(data2,data2$Rotor.length_c2,data2$Time,data2$Repetition,"Effect of Rotor Length","Rotor Length (cm)","Flight Time (seconds)")
onefactor.plot(data2,data2$Base.length_c2,data2$Time,data2$Rep,"Effect of Base Length","Base Length (cm)","Flight Time (seconds)")
onefactor.plot(data2,data2$Base.width_c2,data2$Time,data2$Rep,"Effect of Base Width","Base Width (cm)","Flight Time (seconds)")
Two factor Plot Function
twofactor.plot(data2,data2$Rotor.length_c2,data2$Time, data2$Base.width_c2,'Effect of Rotor Length and Base Width in y Flight','Rotor Length (cm)',"Base Width (cm)")
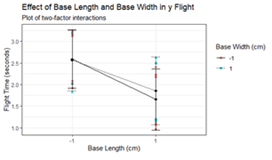
twofactor.plot(data2,data2$Base.length_c2,data2$Time, data2$Base.width_c2,'Effect of Base Length and Base Width in y Flight','Base Length (cm)',"Base Width (cm)")
twofactor.plot(data2,data2$Rotor.length_c2,data2$Time, data2$Base.width_c2,'Effect of Rotor Length and Base Length in y Flight','Rotor Length (cm)',"Base Length (cm)")
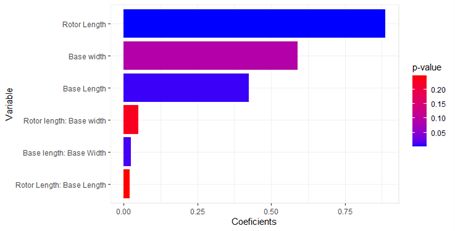
Paretto plot
Regression Analysis
res <-lm(data = data,Time~Rotor.length+Base.length+Base.width+
           Rotor.length*Base.length+
           Base.length*Base.width+
           Rotor.length*Base.width)
res.sum<-summary(res)
res.sum
Plot
res <-lm(data = data,Time~Rotor.length+Base.length+Base.width+
           Rotor.length*Base.length+
           Base.length*Base.width+
           Rotor.length*Base.width)
res.sum<-summary(res)

names.coef<-c('Intercept', 'Rotor Length', 'Base Length',
                           'Base width','Rotor Length: Base Length',
                           'Base length: Base Width','Rotor length: Base width')
paretto.r<-paretto(res.sum,names.coef)
paretto.r$plot
NathalyDM/Final-Project-Biostat documentation built on Dec. 17, 2021, 5:20 a.m.
R Package Documentation
Browse R Packages
We want your feedback!
Note that we can't provide technical support on individual packages. You should contact the package authors for that.
Final-Project-Biostat
How to install
R package with utility functions to help with data analysis you can install this through use devtools:
devtools::install_github("NathalyDM/Final-Project-Biostat", upgrade_dependencies = FALSE)
Packages required
library(ggplot2)
library(tidyverse)
library(rstatix)
library(ggpubr)
library(scales)
library(ggsci)
library(flextable)
library(BiostatSupBiotech)
Boxline plot Function
#Change the path of the file
data <- read.csv("data.csv", header=TRUE, sep=";") # Load the data, modify function if required
colnames(data)[1]<-c('ID')
data
data$Rotor.length_c<- factor(data$Rotor.length,labels=c(-1,0,1))
data$Base.length_c<- factor(data$Base.length,labels=c(-1,0,1))
data$Base.width_c<- factor(data$Base.width,labels=c(-1,0,1))
data
summary(data$Time[data$ID==1])
data$ID_c<-as.factor(rep(1:10,3))
boxline.plot(data,data$ID_c,data$Time,'Helicopter Number','Time of Flight (seconds)',"Box and Mean plot of the different in function of the Helicopter Number", "Graphical Representation of Data")
One factor Plot Function
Mean.Rotor.length<-by(data$Time,data$Rotor.length_c,mean)
Mean.Base_Length<-by(data$Time,data$Base.length_c,mean)
Mean.Base_Width<-by(data$Time,data$Base.width_c,mean)
data$Rep<-as.factor(as.integer(data$Repetition))
data$Rotor.length_c2<- factor(data$Rotor.length_c,labels=c(-1,1), exclude = 0)
data$Base.length_c2<- factor(data$Base.length_c,labels=c(-1,1), exclude = 0)
data$Base.width_c2<- factor(data$Base.width_c,labels=c(-1,1), exclude = 0)
data2<-na.omit(data)
data2$Repetition<-as.factor(data2$Repetition)
onefactor.plot(data2,data2$Rotor.length_c2,data2$Time,data2$Repetition,"Effect of Rotor Length","Rotor Length (cm)","Flight Time (seconds)")
onefactor.plot(data2,data2$Base.length_c2,data2$Time,data2$Rep,"Effect of Base Length","Base Length (cm)","Flight Time (seconds)")
onefactor.plot(data2,data2$Base.width_c2,data2$Time,data2$Rep,"Effect of Base Width","Base Width (cm)","Flight Time (seconds)")
Two factor Plot Function
twofactor.plot(data2,data2$Rotor.length_c2,data2$Time, data2$Base.width_c2,'Effect of Rotor Length and Base Width in y Flight','Rotor Length (cm)',"Base Width (cm)")
twofactor.plot(data2,data2$Base.length_c2,data2$Time, data2$Base.width_c2,'Effect of Base Length and Base Width in y Flight','Base Length (cm)',"Base Width (cm)")
twofactor.plot(data2,data2$Rotor.length_c2,data2$Time, data2$Base.width_c2,'Effect of Rotor Length and Base Length in y Flight','Rotor Length (cm)',"Base Length (cm)")
Paretto plot
Regression Analysis
res <-lm(data = data,Time~Rotor.length+Base.length+Base.width+
Rotor.length*Base.length+
Base.length*Base.width+
Rotor.length*Base.width)
res.sum<-summary(res)
res.sum
Plot
res <-lm(data = data,Time~Rotor.length+Base.length+Base.width+
Rotor.length*Base.length+
Base.length*Base.width+
Rotor.length*Base.width)
res.sum<-summary(res)
names.coef<-c('Intercept', 'Rotor Length', 'Base Length',
'Base width','Rotor Length: Base Length',
'Base length: Base Width','Rotor length: Base width')
paretto.r<-paretto(res.sum,names.coef)
paretto.r$plot
R Package Documentation
Browse R Packages
We want your feedback!
Note that we can't provide technical support on individual packages. You should contact the package authors for that.
Embedding an R snippet on your website
Add the following code to your website.
For more information on customizing the embed code, read Embedding Snippets.