In RRHO2/RRHO2: improved RRHO package
knitr::opts_chunk$set(
  collapse = TRUE,
  comment = "#>"
)
Introduction
Comparing differential expression (DE) patterns across two experimental conditions are commonly encountered in high-throughput data analysis.
Traditionally, researchers will set a cutoff (p-value=0.05 or FDR 5%).
However, adopting these specific cutoffs seems to be arbitary.
For example, it is possible that there is little overlap at these specific cutoffs,
but there is a significant overlap at a released/more stringent statistical criteria.
Plaisier et al. proposed the Rank Rank Hypergeometric Overlap (RRHO) method,
which will examine allpossible cutoffs,
and present the significance level of all these overlap using a heatmap approach.
To be specific, they proposed "enrichment" method and the "two.sided" method to examine and visualize the trend of the overlap of differential expression comparing two experimental conditions.
Details of these methods can be found in the citation from Plaisier et al. below.
The methods are especially successful when the DE patterns are concordant across two experimental conditions (i.e., top significant genes are both upregulated in two conditions, or are both down regulated in two conditions).
Though promising, Cahill et al. noticed that when the DE patterns are discordant (i.e., top significant genes areupregulated in condition 1, but down regulated in condition 2),
the interpretation of the original RRHO method may become complicated and less intuitive.
To overcome these difficulties,
Cahill et al. proposed a "split" method to better visualize both concordant and discordant DE patterns across two experimental conditions.
Details can be found in the citation from Cahill et al. below.
This new method has been implemented in R package RRHO2.
Also see Split representation section for interpretation of the RRHO2 results.
Citations
-
Cahill, K. M., Huo, Z., Tseng, G. C., Logan, R. W., & Seney, M. L. (2018). Improved identification of concordant and discordant gene expression signatures using an updated rank-rank hypergeometric overlap approach. Scientific reports, 8(1), 1-11.
-
Plaisier, S. B., Taschereau, R., Wong, J. A., & Graeber, T. G. (2010). Rank–rank hypergeometric overlap: identification of statistically significant overlap between gene-expression signatures. Nucleic acids research, 38(17), e169-e169.
Split representation
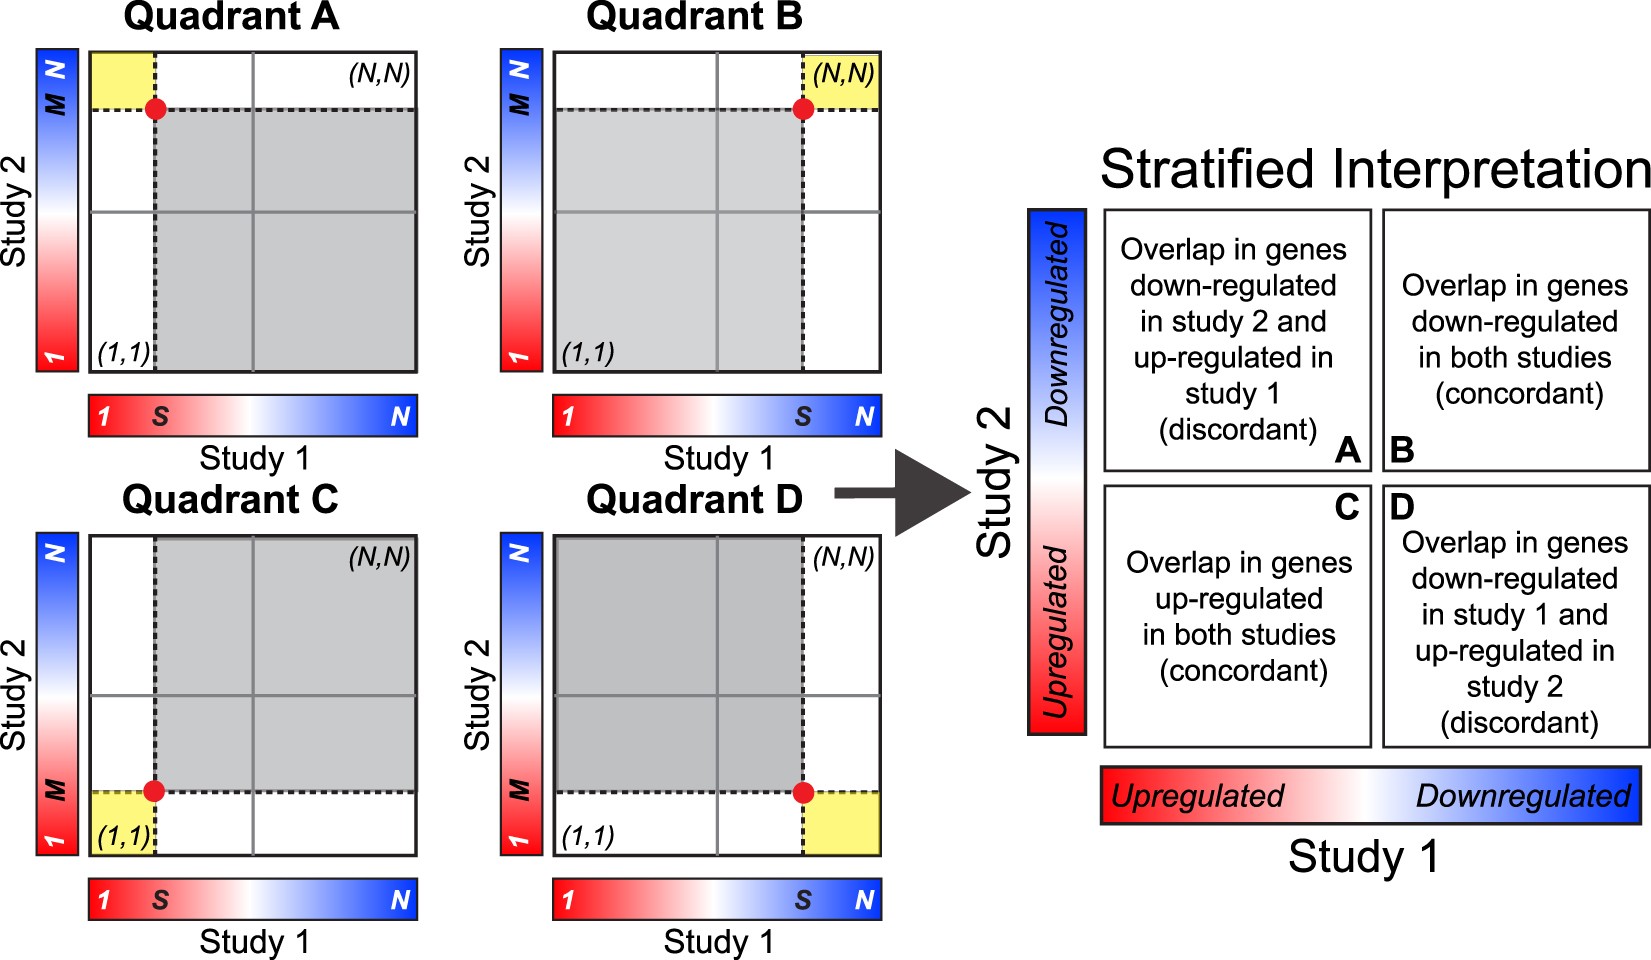
Interpretation of the Stratified RRHO method. A hotspot in quadrant A indicates overlap in genes up-regulated in study 1 and down-regulated in study 2. A hotspot in quadrant B indicates overlap in genes down-regulated in both studies. A hotspot in quadrant C indicates overlap in genes up-regulated in both studies. A hotspot in quadrant D indicates overlap in genes down-regulated in study 1 and up-regulated in study 2
 {width=100%}
Install the package
library(devtools)
install_github("RRHO2/RRHO2")
Load the package
library(RRHO2)
Format of the input data
- The input gene list should have 2 columns, 1st column is the gene symbol, 2nd column is the input score.
- The score should be calculated as -log10(pvalue) * sign(effectSize)
- NA is not allowed
- Gene symbols of the two gene lists should be identical, but don't have to be in the same order
Examples
Example 1, DE patterns are concordant across two experimental conditions (p-value)
A total of 2000 genes in both list 1 and list 2.
In list 1, genes 1-200 are up-regulated; genes 201-400 are down-regulated; the rest of the 1600 genes are noise genes.
In list 2, genes 1-200 are up-regulated; genes 201-400 are down-regulated; the rest of the 1600 genes are noise genes.
Below is the code to simulate this data, and how to run RRHO2
Data simulation
set.seed(15213)
nGenes <- 2000
nDE <- 200
Genes <- paste0("Genes",1:nGenes)

## For up-regulated genes, the input score should be calculated using-log10(pvalue) * 1;
## For down-regulated genes, the input score should be calculated using-log10(pvalue) * (-1);
list1_pvalue_1_200 <- runif(nDE,0,0.05) ## up-regulated genes
list1_pvalue_201_400 <- runif(nDE,0,0.05) ## down-regulated genes
list1_pvalue_401_2000 <- runif(nGenes - 2 * nDE,0,1) ## non-changed genes
list1_DDE <- c(-log10(list1_pvalue_1_200),
    -log10(list1_pvalue_201_400) * (-1),
    -log10(list1_pvalue_401_2000) * sample(c(1,-1), length(list1_pvalue_401_2000), replace = TRUE))

gene_list1 <- data.frame(Genes=Genes,DDE = list1_DDE, stringsAsFactors = FALSE)

list2_pvalue_1_200 <- runif(nDE,0,0.05)
list2_pvalue_201_400 <- runif(nDE,0,0.05)
list2_pvalue_401_2000 <- runif(nGenes - 2 * nDE,0,1)
list2_DDE <- c(-log10(list2_pvalue_1_200), -log10(list2_pvalue_201_400) * (-1), -log10(list2_pvalue_401_2000) * sample(c(1,-1), length(list2_pvalue_401_2000), replace = TRUE))

gene_list2 <- data.frame(Genes=Genes,DDE = list2_DDE, stringsAsFactors = FALSE)
Create the RRHO2 object
RRHO_obj <- RRHO2_initialize(gene_list1, gene_list2, labels = c("list1", "list2"), log10.ind=TRUE)
Visualize the heatmap
RRHO2_heatmap(RRHO_obj)
Get the gene lists (down regulation in list1 and down regulation in list 2) that provide the most significant overlap (option dd)
options:
- dd: down regulation in list1 and down regulation in list 2
- uu: up regulation in list1 and up regulation in list 2
- du: down regulation in list1 and up regulation in list 2
- ud: up regulation in list1 and down regulation in list 2
## gene lists (down regulation in list1 and down regulation in list 2) that provide the most significant overlap
RRHO_obj$genelist_dd

## down regulation genes in list1
RRHO_obj$genelist_dd$gene_list1_dd

## down regulation genes in list2
RRHO_obj$genelist_dd$gene_list2_dd

## overlap between down regulation genes in list1 and list2
RRHO_obj$genelist_dd$gene_list_overlap_dd

#### Visualize by Venn Diagram
RRHO2_vennDiagram(RRHO_obj, type="dd")
To view the head of them
## down regulation genes in list1
head(RRHO_obj$genelist_dd$gene_list1_dd)

## down regulation genes in list2
head(RRHO_obj$genelist_dd$gene_list2_dd)

## overlap between down regulation genes in list1 and list2
head(RRHO_obj$genelist_dd$gene_list_overlap_dd)

#### Visualize by Venn Diagram
RRHO2_vennDiagram(RRHO_obj, type="dd")
Example 2, DE patterns are discordant across two experimental conditions (p-value)
A total of 2000 genes in both list 1 and list 2.
In list 1, genes 1-200 are up-regulated; genes 201-400 are down-regulated; the rest of the 1600 genes are noise genes.
In list 2, genes 1-200 are down-regulated; genes 201-400 are up-regulated; the rest of the 1600 genes are noise genes.
Below is the code to simulate this data, and how to run RRHO2
Data simulation
set.seed(15213)
nGenes <- 2000
nDE <- 200
Genes <- paste0("Genes",1:nGenes)

list1_pvalue_1_200 <- runif(nDE,0,0.05)
list1_pvalue_201_400 <- runif(nDE,0,0.05)
list1_pvalue_401_2000 <- runif(nGenes - 2 * nDE,0,1)
list1_DDE <- c(-log10(list1_pvalue_1_200) * (-1), -log10(list1_pvalue_201_400), -log10(list1_pvalue_401_2000) * sample(c(1,-1), length(list1_pvalue_401_2000), replace = TRUE))

gene_list1 <- data.frame(Genes=Genes,DDE = list1_DDE, stringsAsFactors = FALSE)

list2_pvalue_1_200 <- runif(nDE,0,0.05)
list2_pvalue_201_400 <- runif(nDE,0,0.05)
list2_pvalue_401_2000 <- runif(nGenes - 2 * nDE,0,1)
list2_DDE <- c(-log10(list2_pvalue_1_200), -log10(list2_pvalue_201_400) * (-1), -log10(list2_pvalue_401_2000) * sample(c(1,-1), length(list2_pvalue_401_2000), replace = TRUE))

gene_list2 <- data.frame(Genes=Genes,DDE = list2_DDE, stringsAsFactors = FALSE)
Create the RRHO2 object
RRHO_obj <- RRHO2_initialize(gene_list1, gene_list2, labels = c("list1", "list2"), log10.ind=TRUE)
Visualize the heatmap
RRHO2_heatmap(RRHO_obj)
Get the gene lists (down regulation in list1 and up regulation in list 2) that provide the most significant overlap (option du)
options:
- dd: down regulation in list1 and down regulation in list 2
- uu: up regulation in list1 and up regulation in list 2
- du: down regulation in list1 and up regulation in list 2
- ud: up regulation in list1 and down regulation in list 2
## gene lists (down regulation in list1 and up regulation in list 2) that provide the most significant overlap
RRHO_obj$genelist_du

## down regulation genes in list1
RRHO_obj$genelist_du$gene_list1_du

## down regulation genes in list2
RRHO_obj$genelist_du$gene_list2_du

## overlap between down regulation genes in list1 and list2
RRHO_obj$genelist_du$gene_list_overlap_du

#### Visualize by Venn Diagram
RRHO2_vennDiagram(RRHO_obj, type="du")
To view the head of them
## down regulation genes in list1
head(RRHO_obj$genelist_du$gene_list1_du)

## down regulation genes in list2
head(RRHO_obj$genelist_du$gene_list2_du)

## overlap between down regulation genes in list1 and list2
head(RRHO_obj$genelist_du$gene_list_overlap_du)

#### Visualize by Venn Diagram
RRHO2_vennDiagram(RRHO_obj, type="du")
Example 3, DE patterns are concordant across two experimental conditions (odds-ratio)
This example is very similar to Example 1,
expect using odds ratio instead of p-value to represent overlap.
Data simulation
set.seed(15213)
nGenes <- 2000
nDE <- 200
Genes <- paste0("Genes",1:nGenes)

list1_pvalue_1_200 <- runif(nDE,0,0.05)
list1_pvalue_201_400 <- runif(nDE,0,0.05)
list1_pvalue_401_2000 <- runif(nGenes - 2 * nDE,0,1)
list1_DDE <- c(-log10(list1_pvalue_1_200), -log10(list1_pvalue_201_400) * (-1), -log10(list1_pvalue_401_2000) * sample(c(1,-1), length(list1_pvalue_401_2000), replace = TRUE))

gene_list1 <- data.frame(Genes=Genes,DDE = list1_DDE, stringsAsFactors = FALSE)

list2_pvalue_1_200 <- runif(nDE,0,0.05)
list2_pvalue_201_400 <- runif(nDE,0,0.05)
list2_pvalue_401_2000 <- runif(nGenes - 2 * nDE,0,1)
list2_DDE <- c(-log10(list2_pvalue_1_200), -log10(list2_pvalue_201_400) * (-1), -log10(list2_pvalue_401_2000) * sample(c(1,-1), length(list2_pvalue_401_2000), replace = TRUE))

gene_list2 <- data.frame(Genes=Genes,DDE = list2_DDE, stringsAsFactors = FALSE)
Create the RRHO2 object
RRHO_obj <- RRHO2_initialize(gene_list1, gene_list2, labels = c("list1", "list2"), log10.ind=TRUE, method = "fisher")
Visualize the heatmap
RRHO2_heatmap(RRHO_obj)
Visualize the Venn Diagram
RRHO2_vennDiagram(RRHO_obj, type="dd")
RRHO2/RRHO2 documentation built on March 22, 2022, 12:04 p.m.
R Package Documentation
Browse R Packages
We want your feedback!
Note that we can't provide technical support on individual packages. You should contact the package authors for that.
knitr::opts_chunk$set( collapse = TRUE, comment = "#>" )
Introduction
Comparing differential expression (DE) patterns across two experimental conditions are commonly encountered in high-throughput data analysis. Traditionally, researchers will set a cutoff (p-value=0.05 or FDR 5%). However, adopting these specific cutoffs seems to be arbitary. For example, it is possible that there is little overlap at these specific cutoffs, but there is a significant overlap at a released/more stringent statistical criteria.
Plaisier et al. proposed the Rank Rank Hypergeometric Overlap (RRHO) method, which will examine allpossible cutoffs, and present the significance level of all these overlap using a heatmap approach. To be specific, they proposed "enrichment" method and the "two.sided" method to examine and visualize the trend of the overlap of differential expression comparing two experimental conditions. Details of these methods can be found in the citation from Plaisier et al. below. The methods are especially successful when the DE patterns are concordant across two experimental conditions (i.e., top significant genes are both upregulated in two conditions, or are both down regulated in two conditions).
Though promising, Cahill et al. noticed that when the DE patterns are discordant (i.e., top significant genes areupregulated in condition 1, but down regulated in condition 2), the interpretation of the original RRHO method may become complicated and less intuitive. To overcome these difficulties, Cahill et al. proposed a "split" method to better visualize both concordant and discordant DE patterns across two experimental conditions. Details can be found in the citation from Cahill et al. below. This new method has been implemented in R package RRHO2. Also see Split representation section for interpretation of the RRHO2 results.
Citations
-
Cahill, K. M., Huo, Z., Tseng, G. C., Logan, R. W., & Seney, M. L. (2018). Improved identification of concordant and discordant gene expression signatures using an updated rank-rank hypergeometric overlap approach. Scientific reports, 8(1), 1-11.
-
Plaisier, S. B., Taschereau, R., Wong, J. A., & Graeber, T. G. (2010). Rank–rank hypergeometric overlap: identification of statistically significant overlap between gene-expression signatures. Nucleic acids research, 38(17), e169-e169.
Split representation
Interpretation of the Stratified RRHO method. A hotspot in quadrant A indicates overlap in genes up-regulated in study 1 and down-regulated in study 2. A hotspot in quadrant B indicates overlap in genes down-regulated in both studies. A hotspot in quadrant C indicates overlap in genes up-regulated in both studies. A hotspot in quadrant D indicates overlap in genes down-regulated in study 1 and up-regulated in study 2
{width=100%}
Install the package
library(devtools) install_github("RRHO2/RRHO2")
Load the package
library(RRHO2)
Format of the input data
- The input gene list should have 2 columns, 1st column is the gene symbol, 2nd column is the input score.
- The score should be calculated as -log10(pvalue) * sign(effectSize)
- NA is not allowed
- Gene symbols of the two gene lists should be identical, but don't have to be in the same order
Examples
Example 1, DE patterns are concordant across two experimental conditions (p-value)
A total of 2000 genes in both list 1 and list 2.
In list 1, genes 1-200 are up-regulated; genes 201-400 are down-regulated; the rest of the 1600 genes are noise genes.
In list 2, genes 1-200 are up-regulated; genes 201-400 are down-regulated; the rest of the 1600 genes are noise genes.
Below is the code to simulate this data, and how to run RRHO2
Data simulation
set.seed(15213) nGenes <- 2000 nDE <- 200 Genes <- paste0("Genes",1:nGenes) ## For up-regulated genes, the input score should be calculated using-log10(pvalue) * 1; ## For down-regulated genes, the input score should be calculated using-log10(pvalue) * (-1); list1_pvalue_1_200 <- runif(nDE,0,0.05) ## up-regulated genes list1_pvalue_201_400 <- runif(nDE,0,0.05) ## down-regulated genes list1_pvalue_401_2000 <- runif(nGenes - 2 * nDE,0,1) ## non-changed genes list1_DDE <- c(-log10(list1_pvalue_1_200), -log10(list1_pvalue_201_400) * (-1), -log10(list1_pvalue_401_2000) * sample(c(1,-1), length(list1_pvalue_401_2000), replace = TRUE)) gene_list1 <- data.frame(Genes=Genes,DDE = list1_DDE, stringsAsFactors = FALSE) list2_pvalue_1_200 <- runif(nDE,0,0.05) list2_pvalue_201_400 <- runif(nDE,0,0.05) list2_pvalue_401_2000 <- runif(nGenes - 2 * nDE,0,1) list2_DDE <- c(-log10(list2_pvalue_1_200), -log10(list2_pvalue_201_400) * (-1), -log10(list2_pvalue_401_2000) * sample(c(1,-1), length(list2_pvalue_401_2000), replace = TRUE)) gene_list2 <- data.frame(Genes=Genes,DDE = list2_DDE, stringsAsFactors = FALSE)
Create the RRHO2 object
RRHO_obj <- RRHO2_initialize(gene_list1, gene_list2, labels = c("list1", "list2"), log10.ind=TRUE)
Visualize the heatmap
RRHO2_heatmap(RRHO_obj)
Get the gene lists (down regulation in list1 and down regulation in list 2) that provide the most significant overlap (option dd)
options:
- dd: down regulation in list1 and down regulation in list 2
- uu: up regulation in list1 and up regulation in list 2
- du: down regulation in list1 and up regulation in list 2
- ud: up regulation in list1 and down regulation in list 2
## gene lists (down regulation in list1 and down regulation in list 2) that provide the most significant overlap RRHO_obj$genelist_dd ## down regulation genes in list1 RRHO_obj$genelist_dd$gene_list1_dd ## down regulation genes in list2 RRHO_obj$genelist_dd$gene_list2_dd ## overlap between down regulation genes in list1 and list2 RRHO_obj$genelist_dd$gene_list_overlap_dd #### Visualize by Venn Diagram RRHO2_vennDiagram(RRHO_obj, type="dd")
To view the head of them
## down regulation genes in list1 head(RRHO_obj$genelist_dd$gene_list1_dd) ## down regulation genes in list2 head(RRHO_obj$genelist_dd$gene_list2_dd) ## overlap between down regulation genes in list1 and list2 head(RRHO_obj$genelist_dd$gene_list_overlap_dd) #### Visualize by Venn Diagram RRHO2_vennDiagram(RRHO_obj, type="dd")
Example 2, DE patterns are discordant across two experimental conditions (p-value)
A total of 2000 genes in both list 1 and list 2.
In list 1, genes 1-200 are up-regulated; genes 201-400 are down-regulated; the rest of the 1600 genes are noise genes.
In list 2, genes 1-200 are down-regulated; genes 201-400 are up-regulated; the rest of the 1600 genes are noise genes.
Below is the code to simulate this data, and how to run RRHO2
Data simulation
set.seed(15213) nGenes <- 2000 nDE <- 200 Genes <- paste0("Genes",1:nGenes) list1_pvalue_1_200 <- runif(nDE,0,0.05) list1_pvalue_201_400 <- runif(nDE,0,0.05) list1_pvalue_401_2000 <- runif(nGenes - 2 * nDE,0,1) list1_DDE <- c(-log10(list1_pvalue_1_200) * (-1), -log10(list1_pvalue_201_400), -log10(list1_pvalue_401_2000) * sample(c(1,-1), length(list1_pvalue_401_2000), replace = TRUE)) gene_list1 <- data.frame(Genes=Genes,DDE = list1_DDE, stringsAsFactors = FALSE) list2_pvalue_1_200 <- runif(nDE,0,0.05) list2_pvalue_201_400 <- runif(nDE,0,0.05) list2_pvalue_401_2000 <- runif(nGenes - 2 * nDE,0,1) list2_DDE <- c(-log10(list2_pvalue_1_200), -log10(list2_pvalue_201_400) * (-1), -log10(list2_pvalue_401_2000) * sample(c(1,-1), length(list2_pvalue_401_2000), replace = TRUE)) gene_list2 <- data.frame(Genes=Genes,DDE = list2_DDE, stringsAsFactors = FALSE)
Create the RRHO2 object
RRHO_obj <- RRHO2_initialize(gene_list1, gene_list2, labels = c("list1", "list2"), log10.ind=TRUE)
Visualize the heatmap
RRHO2_heatmap(RRHO_obj)
Get the gene lists (down regulation in list1 and up regulation in list 2) that provide the most significant overlap (option du)
options:
- dd: down regulation in list1 and down regulation in list 2
- uu: up regulation in list1 and up regulation in list 2
- du: down regulation in list1 and up regulation in list 2
- ud: up regulation in list1 and down regulation in list 2
## gene lists (down regulation in list1 and up regulation in list 2) that provide the most significant overlap RRHO_obj$genelist_du ## down regulation genes in list1 RRHO_obj$genelist_du$gene_list1_du ## down regulation genes in list2 RRHO_obj$genelist_du$gene_list2_du ## overlap between down regulation genes in list1 and list2 RRHO_obj$genelist_du$gene_list_overlap_du #### Visualize by Venn Diagram RRHO2_vennDiagram(RRHO_obj, type="du")
To view the head of them
## down regulation genes in list1 head(RRHO_obj$genelist_du$gene_list1_du) ## down regulation genes in list2 head(RRHO_obj$genelist_du$gene_list2_du) ## overlap between down regulation genes in list1 and list2 head(RRHO_obj$genelist_du$gene_list_overlap_du) #### Visualize by Venn Diagram RRHO2_vennDiagram(RRHO_obj, type="du")
Example 3, DE patterns are concordant across two experimental conditions (odds-ratio)
This example is very similar to Example 1, expect using odds ratio instead of p-value to represent overlap.
Data simulation
set.seed(15213) nGenes <- 2000 nDE <- 200 Genes <- paste0("Genes",1:nGenes) list1_pvalue_1_200 <- runif(nDE,0,0.05) list1_pvalue_201_400 <- runif(nDE,0,0.05) list1_pvalue_401_2000 <- runif(nGenes - 2 * nDE,0,1) list1_DDE <- c(-log10(list1_pvalue_1_200), -log10(list1_pvalue_201_400) * (-1), -log10(list1_pvalue_401_2000) * sample(c(1,-1), length(list1_pvalue_401_2000), replace = TRUE)) gene_list1 <- data.frame(Genes=Genes,DDE = list1_DDE, stringsAsFactors = FALSE) list2_pvalue_1_200 <- runif(nDE,0,0.05) list2_pvalue_201_400 <- runif(nDE,0,0.05) list2_pvalue_401_2000 <- runif(nGenes - 2 * nDE,0,1) list2_DDE <- c(-log10(list2_pvalue_1_200), -log10(list2_pvalue_201_400) * (-1), -log10(list2_pvalue_401_2000) * sample(c(1,-1), length(list2_pvalue_401_2000), replace = TRUE)) gene_list2 <- data.frame(Genes=Genes,DDE = list2_DDE, stringsAsFactors = FALSE)
Create the RRHO2 object
RRHO_obj <- RRHO2_initialize(gene_list1, gene_list2, labels = c("list1", "list2"), log10.ind=TRUE, method = "fisher")
Visualize the heatmap
RRHO2_heatmap(RRHO_obj)
Visualize the Venn Diagram
RRHO2_vennDiagram(RRHO_obj, type="dd")
R Package Documentation
Browse R Packages
We want your feedback!
Note that we can't provide technical support on individual packages. You should contact the package authors for that.
Embedding an R snippet on your website
Add the following code to your website.
For more information on customizing the embed code, read Embedding Snippets.