README.md
In ananthu1834/monefystats: Insights into monefy expenses and some additional finance helpers
Monefy Stats
App to visualize and gain additional insights into your Monefy transaction data. Click here for the hosted solution -> https://ananthu1835.shinyapps.io/monefyshiny/
Introduction
Monefy Stats is a simple package to visualize Monefy transaction data over a period of time. This is an additional layer on top of existing Monefy features.
Monefy android app has been of great help to me with its amazing and simple UI/UX, along with elegant abstractions. But I wish it had a few more statistics and trend plots to help me get more insights into the data. Hence this package and the Shiny App
Installation
Not yet available on cran. Can be installed using devtools
devtools::install_github('ananthu1834/monefystats')
Usage
The App is hosted here and is open for anyone to use -> https://ananthu1835.shinyapps.io/monefyshiny/. But, you can also install it on your system if you are paranoid about data privacy.
The package uses csv data exported by the Monefy app. I could not find any APIs to get this data directly, so please inform me if someone know about it and I can add the capability to do so.
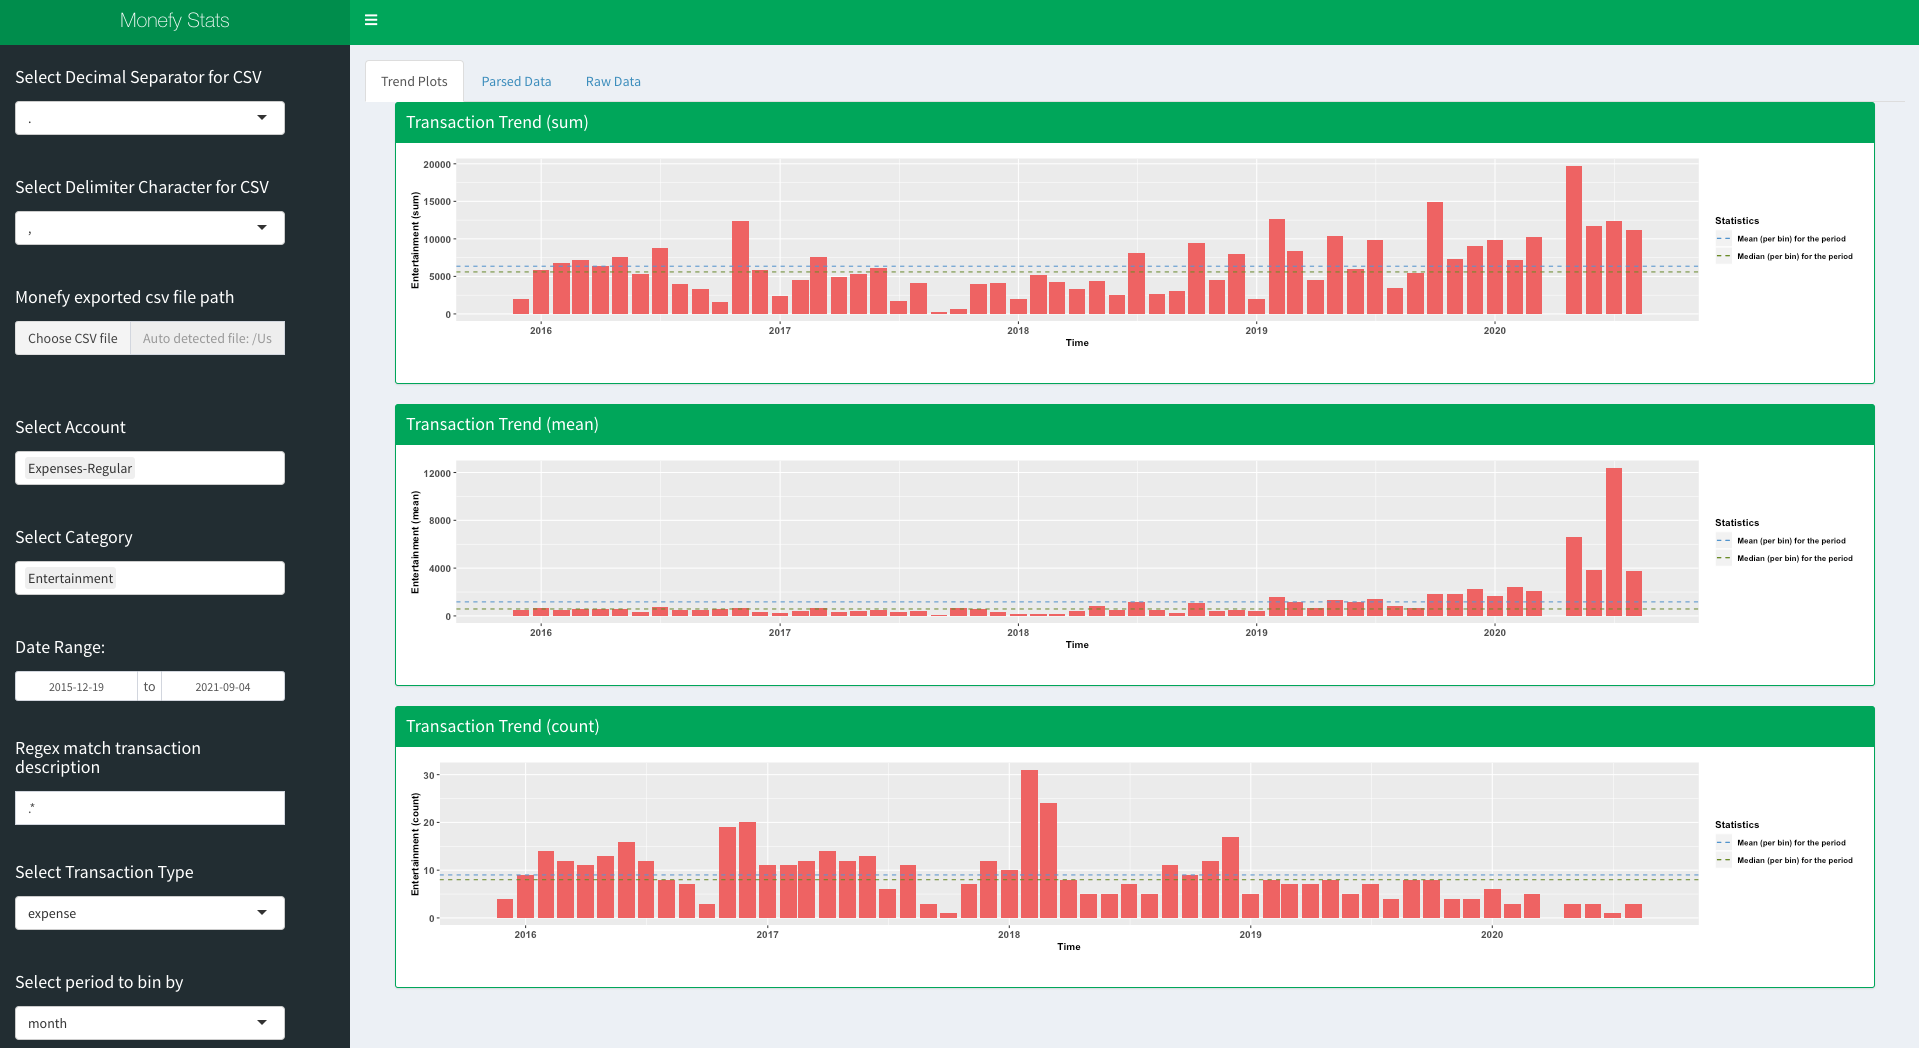
Here is an example screenshot to get a sense of what the app looks like in action. Run the following command to get it running on your system
runApp('monefyShiny')
Features
- Automatic parsing and cleaning of Monefy exported CSV file
- Trend plot of expenses, incomes and combined with configurable time bins
- Filter by account, category, transaction_type and time period
- Regex search of matching description field as an advanced filter
- Automatic detection of latest input csv for Mac users downloading the file into standard 'Downloads' directory
- Visualise raw and parsed data as tables
- Basic statistics for the given filter criteria
ananthu1834/monefystats documentation built on Oct. 6, 2020, 2:50 a.m.
R Package Documentation
Browse R Packages
We want your feedback!
Note that we can't provide technical support on individual packages. You should contact the package authors for that.
Monefy Stats
App to visualize and gain additional insights into your Monefy transaction data. Click here for the hosted solution -> https://ananthu1835.shinyapps.io/monefyshiny/
Introduction
Monefy Stats is a simple package to visualize Monefy transaction data over a period of time. This is an additional layer on top of existing Monefy features. Monefy android app has been of great help to me with its amazing and simple UI/UX, along with elegant abstractions. But I wish it had a few more statistics and trend plots to help me get more insights into the data. Hence this package and the Shiny App
Installation
Not yet available on cran. Can be installed using devtools
devtools::install_github('ananthu1834/monefystats')
Usage
The App is hosted here and is open for anyone to use -> https://ananthu1835.shinyapps.io/monefyshiny/. But, you can also install it on your system if you are paranoid about data privacy.
The package uses csv data exported by the Monefy app. I could not find any APIs to get this data directly, so please inform me if someone know about it and I can add the capability to do so.
Here is an example screenshot to get a sense of what the app looks like in action. Run the following command to get it running on your system
runApp('monefyShiny')
Features
- Automatic parsing and cleaning of Monefy exported CSV file
- Trend plot of expenses, incomes and combined with configurable time bins
- Filter by account, category, transaction_type and time period
- Regex search of matching description field as an advanced filter
- Automatic detection of latest input csv for Mac users downloading the file into standard 'Downloads' directory
- Visualise raw and parsed data as tables
- Basic statistics for the given filter criteria
R Package Documentation
Browse R Packages
We want your feedback!
Note that we can't provide technical support on individual packages. You should contact the package authors for that.
Embedding an R snippet on your website
Add the following code to your website.
For more information on customizing the embed code, read Embedding Snippets.