README.md
In annikacleven/regtreesegpackage: Segmenting CNV and BAF data using regression tree methods
regtreeseg
Introduction
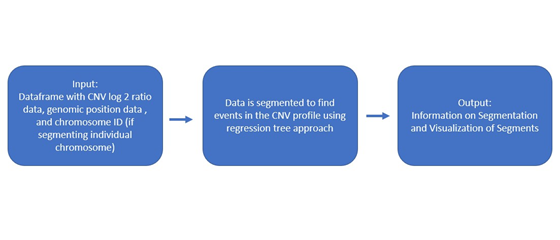
The goal of this package is to segment events in a CNV's profile based on the log_2 ratio and the genomic position using a regression tree approach. A log_2 ratio above zero means that there is a amplification in copy number in the sample genome compared to the reference genome. On the other hand, if the log_2 ratio is below zero then there is a deletion in the copy number in the sample genome compared to the reference genome.
This package provides a way to segment a CNV's profile and visualize the segmentation of individual chromosomes and the full genome.
Installation
To install the most updated version of this package use the following:
```{r, eval = FALSE}
install.packages("devtools")
library(devtools)
devtools::install_github("annikacleven/regtreesegpackage", build_vignettes = TRUE)
library(regtreeseg)
## Resources and Vignette
The regtreeseg provides more in depth explanation of the functions and provides sample code for the reader. The regtreeseg vignette includes sample code on how to use each of the segmenting functions. The vignette also dives into optional operations of the functions and more details on the complexity parameter used to segment the genomic data. The vignette is available upon download of the package.
To view the vignette, first install the package as seen above. Then, in the R Studio pane that has Plots, Files, Packages, and Help, choose "Packages". Then find and choose the regtreeseg package. In the Documentation section, choose "User guides, package vignettes, and other documentation". Choose "regtreeseg::regtreeseg" to view the vignette.
There is also the choice to choose "HTML" and then "Show in a new Window".
## Overview
Using a regression tree approach set up in the 'rpart' package, CNV log_2 ratio data can be segmented with multiple approaches. In the regression tree approaches the response variable is the log_2 ratio and the explanatory variable is the genomic location. Therefore the data is partitioned into segments that predict the log_2 ratio for the genomic positions in each segment. In regtreeseg, the regression trees use the complexity parameter optimized to have the minimum cross validation error. The complexity parameter is the minimum increase in the R^2 that the split in the regression tree must create for the split to be included. The innovation of this package is using an iteration of regression trees to create a regression tree that catches all events in the CNV profile. Beyond the iteration, an option to weight points farther from the log_2 ratio of 0 is available. Using iteration with no weighting is typically the best option for segmenting the data.
There are three segmentation methods in this package:
1. Segmentation using an optimal complexity parameter (cp)
2. Segmentation using an optimal cp value and 3 regression tree iterations
3. Segmentation using an optimal cp value, 3 regression tree iterations, and weighting
<br/>
<br/>
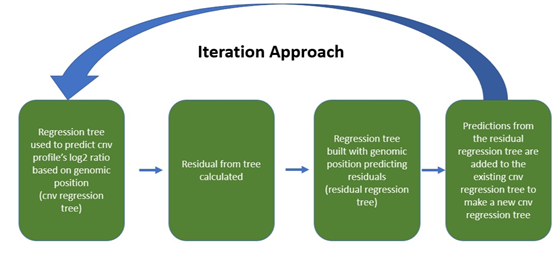
The use of an iterative regression tree approach allows for the tree to catch events in the CNV profile on the first round and then catch other less prominent events in the next iterations. This approach identifies more CNV events, than a single regression tree.
To begin the iterative regression tree approach, the data is segmented using a regression tree with the optimal complexity parameter (unless specified otherwise). The predictions from this regression tree are the first iteration (pred1). Then the residual error is calculated. Using the optimal complexity parameter (cp) for this residual data a regression tree is fitted to the data. This regression tree predicts the spikes in the residual error with an explanatory variable of the genomic location (pred2). Then the predictions from the initial regression tree (pred1) and the second regression tree (pred2) are added together to create a new prediction. Then a third iteration follows. The residuals are calculated from the combined prediction of pred1+pred2 and using the cpopt another regression tree is fitted to this residual data (pred3). Then the predictions from each iteration are added together (pred1+pred2+pred3) for the final prediction.
<br/>
The functions in this package segment either a single chromosome or the full genome. When segmenting the full genome each chromosome is segmented separately and then each chromosome's segmentation is included in a full report.
## Demonstration
More detailed instructions on how to execute each of the segmentation methods can be viewed in the vignette. A description of the flow of the function is provided below. Since the iterative approach with optimal cp value is the typically the best option an example of how to use the iterative regression tree approach with optimal cp values for a single chromosome is provided. The other functions (seg.chr, iterseg.chr.weighted) are run in a similar way. There are more examples of these examples and segmentation of the full genome in the R package vignette2.
```{r, eval = FALSE}
library(regtreeseg)
data("chr3sample")
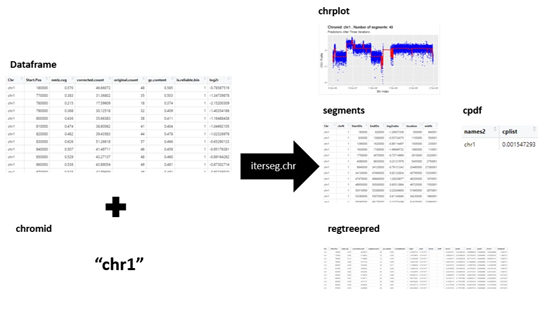
demo <- iterseg.chr(chr3sample, chromid = "chr3")
demo$chrplot
demo$segments
Dataframe input specification
This package was created to segment the genomic data from an in-house Mayo Clinic system that provided the normalized coverage at each bin location. The log_2 ratio for each location can be calculated from the normalized coverage. In the common data format there are other columns of information that are provided, but this package has generalized the input structure for more accesible usage.
The inputs of the functions in this package require a dataframe that has column names specifically labeled as "Start.Pos", "log2r", and "Chr".
The "Start.Pos" column is the bin index or genomic location which the log2ratio comes from.
The "log2r" column is the log2ratio between the sample genome and the reference genome.
The "Chr" column is the chromosome of interest. The chromosomes should be labeled exactly as "chr1", "chr2", "chr22", "chrX", "chrY".
annikacleven/regtreesegpackage documentation built on Dec. 19, 2021, 3:40 a.m.
R Package Documentation
Browse R Packages
We want your feedback!
Note that we can't provide technical support on individual packages. You should contact the package authors for that.
regtreeseg
Introduction
The goal of this package is to segment events in a CNV's profile based on the log_2 ratio and the genomic position using a regression tree approach. A log_2 ratio above zero means that there is a amplification in copy number in the sample genome compared to the reference genome. On the other hand, if the log_2 ratio is below zero then there is a deletion in the copy number in the sample genome compared to the reference genome.
This package provides a way to segment a CNV's profile and visualize the segmentation of individual chromosomes and the full genome.
Installation
To install the most updated version of this package use the following:
```{r, eval = FALSE} install.packages("devtools") library(devtools) devtools::install_github("annikacleven/regtreesegpackage", build_vignettes = TRUE) library(regtreeseg)
## Resources and Vignette
The regtreeseg provides more in depth explanation of the functions and provides sample code for the reader. The regtreeseg vignette includes sample code on how to use each of the segmenting functions. The vignette also dives into optional operations of the functions and more details on the complexity parameter used to segment the genomic data. The vignette is available upon download of the package.
To view the vignette, first install the package as seen above. Then, in the R Studio pane that has Plots, Files, Packages, and Help, choose "Packages". Then find and choose the regtreeseg package. In the Documentation section, choose "User guides, package vignettes, and other documentation". Choose "regtreeseg::regtreeseg" to view the vignette.
There is also the choice to choose "HTML" and then "Show in a new Window".
## Overview
Using a regression tree approach set up in the 'rpart' package, CNV log_2 ratio data can be segmented with multiple approaches. In the regression tree approaches the response variable is the log_2 ratio and the explanatory variable is the genomic location. Therefore the data is partitioned into segments that predict the log_2 ratio for the genomic positions in each segment. In regtreeseg, the regression trees use the complexity parameter optimized to have the minimum cross validation error. The complexity parameter is the minimum increase in the R^2 that the split in the regression tree must create for the split to be included. The innovation of this package is using an iteration of regression trees to create a regression tree that catches all events in the CNV profile. Beyond the iteration, an option to weight points farther from the log_2 ratio of 0 is available. Using iteration with no weighting is typically the best option for segmenting the data.
There are three segmentation methods in this package:
1. Segmentation using an optimal complexity parameter (cp)
2. Segmentation using an optimal cp value and 3 regression tree iterations
3. Segmentation using an optimal cp value, 3 regression tree iterations, and weighting

<br/>
<br/>
The use of an iterative regression tree approach allows for the tree to catch events in the CNV profile on the first round and then catch other less prominent events in the next iterations. This approach identifies more CNV events, than a single regression tree.
To begin the iterative regression tree approach, the data is segmented using a regression tree with the optimal complexity parameter (unless specified otherwise). The predictions from this regression tree are the first iteration (pred1). Then the residual error is calculated. Using the optimal complexity parameter (cp) for this residual data a regression tree is fitted to the data. This regression tree predicts the spikes in the residual error with an explanatory variable of the genomic location (pred2). Then the predictions from the initial regression tree (pred1) and the second regression tree (pred2) are added together to create a new prediction. Then a third iteration follows. The residuals are calculated from the combined prediction of pred1+pred2 and using the cpopt another regression tree is fitted to this residual data (pred3). Then the predictions from each iteration are added together (pred1+pred2+pred3) for the final prediction.
<br/>

The functions in this package segment either a single chromosome or the full genome. When segmenting the full genome each chromosome is segmented separately and then each chromosome's segmentation is included in a full report.
## Demonstration
More detailed instructions on how to execute each of the segmentation methods can be viewed in the vignette. A description of the flow of the function is provided below. Since the iterative approach with optimal cp value is the typically the best option an example of how to use the iterative regression tree approach with optimal cp values for a single chromosome is provided. The other functions (seg.chr, iterseg.chr.weighted) are run in a similar way. There are more examples of these examples and segmentation of the full genome in the R package vignette2.

```{r, eval = FALSE}
library(regtreeseg)
data("chr3sample")
demo <- iterseg.chr(chr3sample, chromid = "chr3")
demo$chrplot
demo$segments
Dataframe input specification
This package was created to segment the genomic data from an in-house Mayo Clinic system that provided the normalized coverage at each bin location. The log_2 ratio for each location can be calculated from the normalized coverage. In the common data format there are other columns of information that are provided, but this package has generalized the input structure for more accesible usage.
The inputs of the functions in this package require a dataframe that has column names specifically labeled as "Start.Pos", "log2r", and "Chr". The "Start.Pos" column is the bin index or genomic location which the log2ratio comes from. The "log2r" column is the log2ratio between the sample genome and the reference genome. The "Chr" column is the chromosome of interest. The chromosomes should be labeled exactly as "chr1", "chr2", "chr22", "chrX", "chrY".
R Package Documentation
Browse R Packages
We want your feedback!
Note that we can't provide technical support on individual packages. You should contact the package authors for that.
Embedding an R snippet on your website
Add the following code to your website.
For more information on customizing the embed code, read Embedding Snippets.