README.md
In benjamin-ackerman/halloween:
halloween: an R package for plotting Halloween candy popularity
Welcome to the website for my R package, halloween! This package is created as part of the Advanced Data Science course at in the Biostatistics department at JHSPH. The purpose of this package is to plot the top-ranked halloween candies using data from this FiveThirtyEight blogpost.
plot_candy() function
The main function of this package is called plot_candy. The function takes in the following parameters:
1) df: The name of the data frame
2) n: The number of top candies to plot (default is 10)
3) candy_name_col: The name of the column in the data frame df containing the candy names
4) rank_col: The name of the column in the data frame df containing the candy rankings
The output of the function is a ggplot object, depicting the top n ranked candies in the dataset.
Using the package
In order to use the package, you must first install it from this GitHub repo, which can be done using the devtools package:
library(devtools)
devtools::install_github('benjamin-ackerman/halloween')
Next, you must load the R package:
library(halloween)
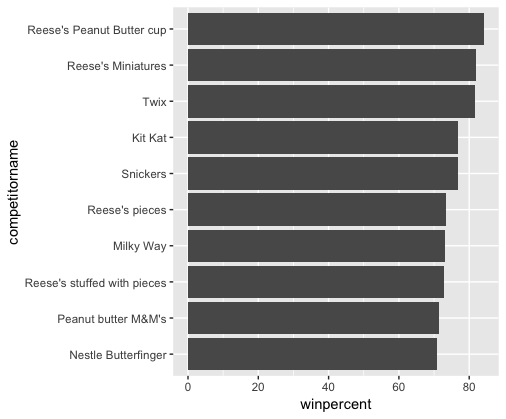
Here's an example of how to use the plot_candy() function:
plot_candy(candy_data, candy_name_col = "competitorname", rank_col = "winpercent")
Running the code above will generate the following plot:
benjamin-ackerman/halloween documentation built on Oct. 9, 2019, 6:44 a.m.
R Package Documentation
Browse R Packages
We want your feedback!
Note that we can't provide technical support on individual packages. You should contact the package authors for that.
halloween: an R package for plotting Halloween candy popularity
Welcome to the website for my R package, halloween! This package is created as part of the Advanced Data Science course at in the Biostatistics department at JHSPH. The purpose of this package is to plot the top-ranked halloween candies using data from this FiveThirtyEight blogpost.
plot_candy() function
The main function of this package is called plot_candy. The function takes in the following parameters:
1) df: The name of the data frame
2) n: The number of top candies to plot (default is 10)
3) candy_name_col: The name of the column in the data frame df containing the candy names
4) rank_col: The name of the column in the data frame df containing the candy rankings
The output of the function is a ggplot object, depicting the top n ranked candies in the dataset.
Using the package
In order to use the package, you must first install it from this GitHub repo, which can be done using the devtools package:
library(devtools)
devtools::install_github('benjamin-ackerman/halloween')
Next, you must load the R package:
library(halloween)
Here's an example of how to use the plot_candy() function:
plot_candy(candy_data, candy_name_col = "competitorname", rank_col = "winpercent")
Running the code above will generate the following plot:
R Package Documentation
Browse R Packages
We want your feedback!
Note that we can't provide technical support on individual packages. You should contact the package authors for that.
Embedding an R snippet on your website
Add the following code to your website.
For more information on customizing the embed code, read Embedding Snippets.