In briandconnelly/numerous: Interact with the Numerous API
knitr::opts_chunk$set(cache=FALSE)
knitr::opts_chunk$set(fig.path="figures/")
library(numerous)
set_numerous_key()
numerous


Note: Numerous is shutting down, so this package is no longer being developed.
Numerous is a service for sharing and following numbers such as stock prices, temperatures, the number of processes running on a server, or the number of times you've visited the gym this week.
This package allows you to create, modify, and interact with data on numerous quickly and easily from within R through the Numerous API.
Installation
This package is not quite ready to be available on CRAN, but you can use devtools to install the current development version:
devtools::install_github("briandconnelly/numerous")
First: Getting Your API key
Before you can interact with Numerous, you'll need to get your key.
Launch the mobile application (iOS, Android), and go to Settings and Developer Info.
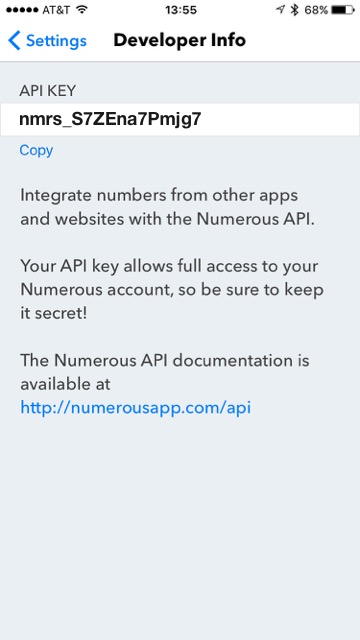
In this screenshot, we see that our API key is nmrs_S7ZEna7Pmjg7.
Keep this number handy, as you'll need it right away.
Optionally, you can save the key in your environment as NUMEROUS_API_KEY (or whatever else you'd like).
Getting Started
Now that you've installed the numerous package, installed the mobile app, and found your API key, it's time to get started.
Start up R and load the package:
library(numerous)
Now, we're going to set the API key using the set_numerous_key function.
This must be done before interacting with Numerous.
The Manual Option
The most straightforward way to set your key is to provide it as the key argument to set_numerous_key:
set_numerous_key(key = "nmrs_S7ZEna7Pmjg7")
Of course, you'll want to replace nmrs_S7ZEna7Pmjg7 with your own key.
Setting the Key from Your Environment
You can also use the value of an environment variable to set the key.
This is especially useful if you use Numerous in multiple ways (e.g., Python scripts, shell scripts, etc.).
To specify where to find your key, use the env argument.
For example, if you stored your key in the variable MY_NUMEROUS_KEY:
set_numerous_key(env = "MY_NUMEROUS_KEY")
By default, this package uses NUMEROUS_API_KEY, so if you've saved your key there, you can just run:
set_numerous_key()
Now that your key is set, it's time to start working with Numerous.
Viewing a Metric
We can get information about a metric using the get_metric function and specifying that
metric's ID. If you don't know any metrics, we can get a list of the most popular ones
using get_popular_metrics. Here, we'll use the count argument to get the most popular metric:
pop_metric <- get_popular_metrics(count = 1)
We can now get some information about this metric by looking at its values. For example,
we can get the metric's label and its current value:
pop_metric[[1]]$label
pop_metric[[1]]$value
So this metric is called Phase of the Moon, and its current value is 0.36.
If you'd like to see the current phase of the moon any time you want on your mobile device, you can subscribe to it:
subinfo <- subscribe(metric_id = pop_metric[[1]]$id)
subinfo now stores information about your subscription.
Creating a Metric
We're really here to interact with our own metrics. Let's create a new one
called "Fun-O-Meter" that stores a value as a percent. Since we're just getting
started, we'll set the initial value to 0.33.
funometer <- create_metric(label = "Fun-O-Meter", kind = "percent", value = 0.33)
Our new Fun-O-Meter metric is now ready to go. If you take a look at funometer,
you'll see it contains all the basic information.
funometer
Updating a Metric's Value
In Numerous speak, an event updates the value of a metric. Let's first set the
value of our Fun-O-Meter to a "meh" 0.5:
create_event(metric_id = funometer$id, value = 0.5)
Events can also increment a value by a given amount. Because we're so excited about
this, we're going to update the Fun-O-Meter to the "not bad" territory by adding
0.1:
create_event(metric_id = funometer$id, value = 0.1, add=TRUE)
Setting Notifications
TODO - use update_subscription() to get notifications whenever fun-o-meter goes above 90%
Plotting a Metric's Values
We can easily plot a metric's value over time using R's base graphics. Here,
we'll get the "Phase of the Moon" metric and plot its values.
moonphase <- get_metric(metric_id = "5676005772602922464")
plot(moonphase)
Different labels and other properties can be specified using the
standard graphical parameters. Here, we'll change the labels and plot lines
instead of points:
plot(moonphase, type = "l", xlab = "Month", ylab = "Value")
Plotting with ggplot
Creating plots with ggplot2 is also
easy. We'll first get a data frame containing a metric's values by using the df
option to get_events and then create a plot using that data frame.
library(ggplot2)
library(scales)

moon_events <- get_events(metric_id = moonphase$id, df = TRUE)
ggplot(data = moon_events, aes(x=updated, y=value)) +
    geom_line() +
    scale_x_datetime(breaks = date_breaks("1 month"),
                     minor_breaks = date_breaks("1 week")) +
    labs(title=moonphase$label)
Related Projects
Code of Conduct
This project is released with a Contributor Code of Conduct. By participating in this project you agree to abide by its terms.
Disclaimer
This package and its developer are in no way affiliated with Numerous, Inc.
briandconnelly/numerous documentation built on May 13, 2019, 5:14 a.m.
R Package Documentation
Browse R Packages
We want your feedback!
Note that we can't provide technical support on individual packages. You should contact the package authors for that.
knitr::opts_chunk$set(cache=FALSE) knitr::opts_chunk$set(fig.path="figures/") library(numerous) set_numerous_key()
numerous
Note: Numerous is shutting down, so this package is no longer being developed.
Numerous is a service for sharing and following numbers such as stock prices, temperatures, the number of processes running on a server, or the number of times you've visited the gym this week. This package allows you to create, modify, and interact with data on numerous quickly and easily from within R through the Numerous API.
Installation
This package is not quite ready to be available on CRAN, but you can use devtools to install the current development version:
devtools::install_github("briandconnelly/numerous")
First: Getting Your API key
Before you can interact with Numerous, you'll need to get your key. Launch the mobile application (iOS, Android), and go to Settings and Developer Info.
In this screenshot, we see that our API key is nmrs_S7ZEna7Pmjg7.
Keep this number handy, as you'll need it right away.
Optionally, you can save the key in your environment as NUMEROUS_API_KEY (or whatever else you'd like).
Getting Started
Now that you've installed the numerous package, installed the mobile app, and found your API key, it's time to get started.
Start up R and load the package:
library(numerous)
Now, we're going to set the API key using the set_numerous_key function.
This must be done before interacting with Numerous.
The Manual Option
The most straightforward way to set your key is to provide it as the key argument to set_numerous_key:
set_numerous_key(key = "nmrs_S7ZEna7Pmjg7")
Of course, you'll want to replace nmrs_S7ZEna7Pmjg7 with your own key.
Setting the Key from Your Environment
You can also use the value of an environment variable to set the key.
This is especially useful if you use Numerous in multiple ways (e.g., Python scripts, shell scripts, etc.).
To specify where to find your key, use the env argument.
For example, if you stored your key in the variable MY_NUMEROUS_KEY:
set_numerous_key(env = "MY_NUMEROUS_KEY")
By default, this package uses NUMEROUS_API_KEY, so if you've saved your key there, you can just run:
set_numerous_key()
Now that your key is set, it's time to start working with Numerous.
Viewing a Metric
We can get information about a metric using the get_metric function and specifying that
metric's ID. If you don't know any metrics, we can get a list of the most popular ones
using get_popular_metrics. Here, we'll use the count argument to get the most popular metric:
pop_metric <- get_popular_metrics(count = 1)
We can now get some information about this metric by looking at its values. For example, we can get the metric's label and its current value:
pop_metric[[1]]$label pop_metric[[1]]$value
So this metric is called Phase of the Moon, and its current value is 0.36.
If you'd like to see the current phase of the moon any time you want on your mobile device, you can subscribe to it:
subinfo <- subscribe(metric_id = pop_metric[[1]]$id)
subinfo now stores information about your subscription.
Creating a Metric
We're really here to interact with our own metrics. Let's create a new one called "Fun-O-Meter" that stores a value as a percent. Since we're just getting started, we'll set the initial value to 0.33.
funometer <- create_metric(label = "Fun-O-Meter", kind = "percent", value = 0.33)
Our new Fun-O-Meter metric is now ready to go. If you take a look at funometer,
you'll see it contains all the basic information.
funometer
Updating a Metric's Value
In Numerous speak, an event updates the value of a metric. Let's first set the value of our Fun-O-Meter to a "meh" 0.5:
create_event(metric_id = funometer$id, value = 0.5)
Events can also increment a value by a given amount. Because we're so excited about this, we're going to update the Fun-O-Meter to the "not bad" territory by adding 0.1:
create_event(metric_id = funometer$id, value = 0.1, add=TRUE)
Setting Notifications
TODO - use update_subscription() to get notifications whenever fun-o-meter goes above 90%
Plotting a Metric's Values
We can easily plot a metric's value over time using R's base graphics. Here, we'll get the "Phase of the Moon" metric and plot its values.
moonphase <- get_metric(metric_id = "5676005772602922464") plot(moonphase)
Different labels and other properties can be specified using the standard graphical parameters. Here, we'll change the labels and plot lines instead of points:
plot(moonphase, type = "l", xlab = "Month", ylab = "Value")
Plotting with ggplot
Creating plots with ggplot2 is also
easy. We'll first get a data frame containing a metric's values by using the df
option to get_events and then create a plot using that data frame.
library(ggplot2) library(scales) moon_events <- get_events(metric_id = moonphase$id, df = TRUE) ggplot(data = moon_events, aes(x=updated, y=value)) + geom_line() + scale_x_datetime(breaks = date_breaks("1 month"), minor_breaks = date_breaks("1 week")) + labs(title=moonphase$label)
Related Projects
Code of Conduct
This project is released with a Contributor Code of Conduct. By participating in this project you agree to abide by its terms.
Disclaimer
This package and its developer are in no way affiliated with Numerous, Inc.
R Package Documentation
Browse R Packages
We want your feedback!
Note that we can't provide technical support on individual packages. You should contact the package authors for that.
Embedding an R snippet on your website
Add the following code to your website.
For more information on customizing the embed code, read Embedding Snippets.