In brunobrr/bdc: Biodiversity Data Cleaning
knitr::opts_chunk$set(
  collapse = TRUE,
  comment = "#>",
  fig.path = "man/figures/README-",
  out.width = "100%",
  echo = TRUE,
  warning = FALSE,
  eval = T
)
library(bdc)
Introduction
This module of the bdc package extracts the collection year whenever possible from complete and legitimate date information and flags dubious (e.g., 07/07/10), illegitimate (e.g., 1300, 2100), or not supplied (e.g., 0 or NA) collecting year.
Installation
Check here how to install the bdc package.
Reading the database
Read the database created in the Space module of the bdc package. It is also possible to read any datasets containing the **required** fields to run the function (more details here).
database <-
  readr::read_csv(here::here("Output/Intermediate/03_space_database.csv"))
database <-
  readr::read_csv(system.file("extdata/outpus_vignettes/03_space_database.csv", package = "bdc"), show_col_types = FALSE)
DT::datatable(
  database[1:15,], class = 'stripe', extensions = 'FixedColumns',
  rownames = FALSE,
  options = list(
    pageLength = 3,
    dom = 'Bfrtip',
    scrollX = TRUE,
    fixedColumns = list(leftColumns = 2)
  )
)
⚠️IMPORTANT:
The results of the VALIDATION test used to flag data quality are appended in separate fields in this database and retrieved as TRUE (✅ ok) or FALSE (❌check carefully).
1 - Records lacking event date information
VALIDATION. This function flags records lacking event date information (e.g., empty or NA).
check_time <-
  bdc_eventDate_empty(data = database, eventDate = "verbatimEventDate")
2 - Extract year from event date
ENRICHMENT. This function extracts four-digit years from unambiguously interpretable collecting dates.
check_time <-
  bdc_year_from_eventDate(data = check_time, eventDate = "verbatimEventDate")
3 - Records with out-of-range collecting year
VALIDATION. This function identifies records with illegitimate or potentially imprecise collecting years. The year provided can be out-of-range (e.g., in the future) or collected before a specified year supplied by the user (e.g., 1900). Older records are more likely to be imprecise due to the locality-derived geo-referencing process.
check_time <-
  bdc_year_outOfRange(data = check_time,
                      eventDate = "year",
                      year_threshold = 1900)
Report
Here we create a column named .summary summing up the results of all VALIDATION tests. This column is FALSE when a record is flagged as FALSE in any data quality test (❌check carefully. potentially invalid or suspect record).
check_time <- bdc_summary_col(data = check_time)
Creating a report summarizing the results of all tests of the bdc package. The report can be automatically saved if save_report = TRUE.
report <-
  bdc_create_report(data = check_time,
                    database_id = "database_id",
                    workflow_step = "time",
                    save_report = FALSE)

report
report <-
  readr::read_csv(
    system.file("extdata/outpus_vignettes/04_Report_time.csv",
                package = "bdc"),
    show_col_types = FALSE
  )
DT::datatable(
  report, class = 'stripe', extensions = 'FixedColumns',
  rownames = FALSE,
  options = list(
    # pageLength = 5,
    dom = 'Bfrtip',
    scrollX = TRUE,
    fixedColumns = list(leftColumns = 2)
  )
)
Figures
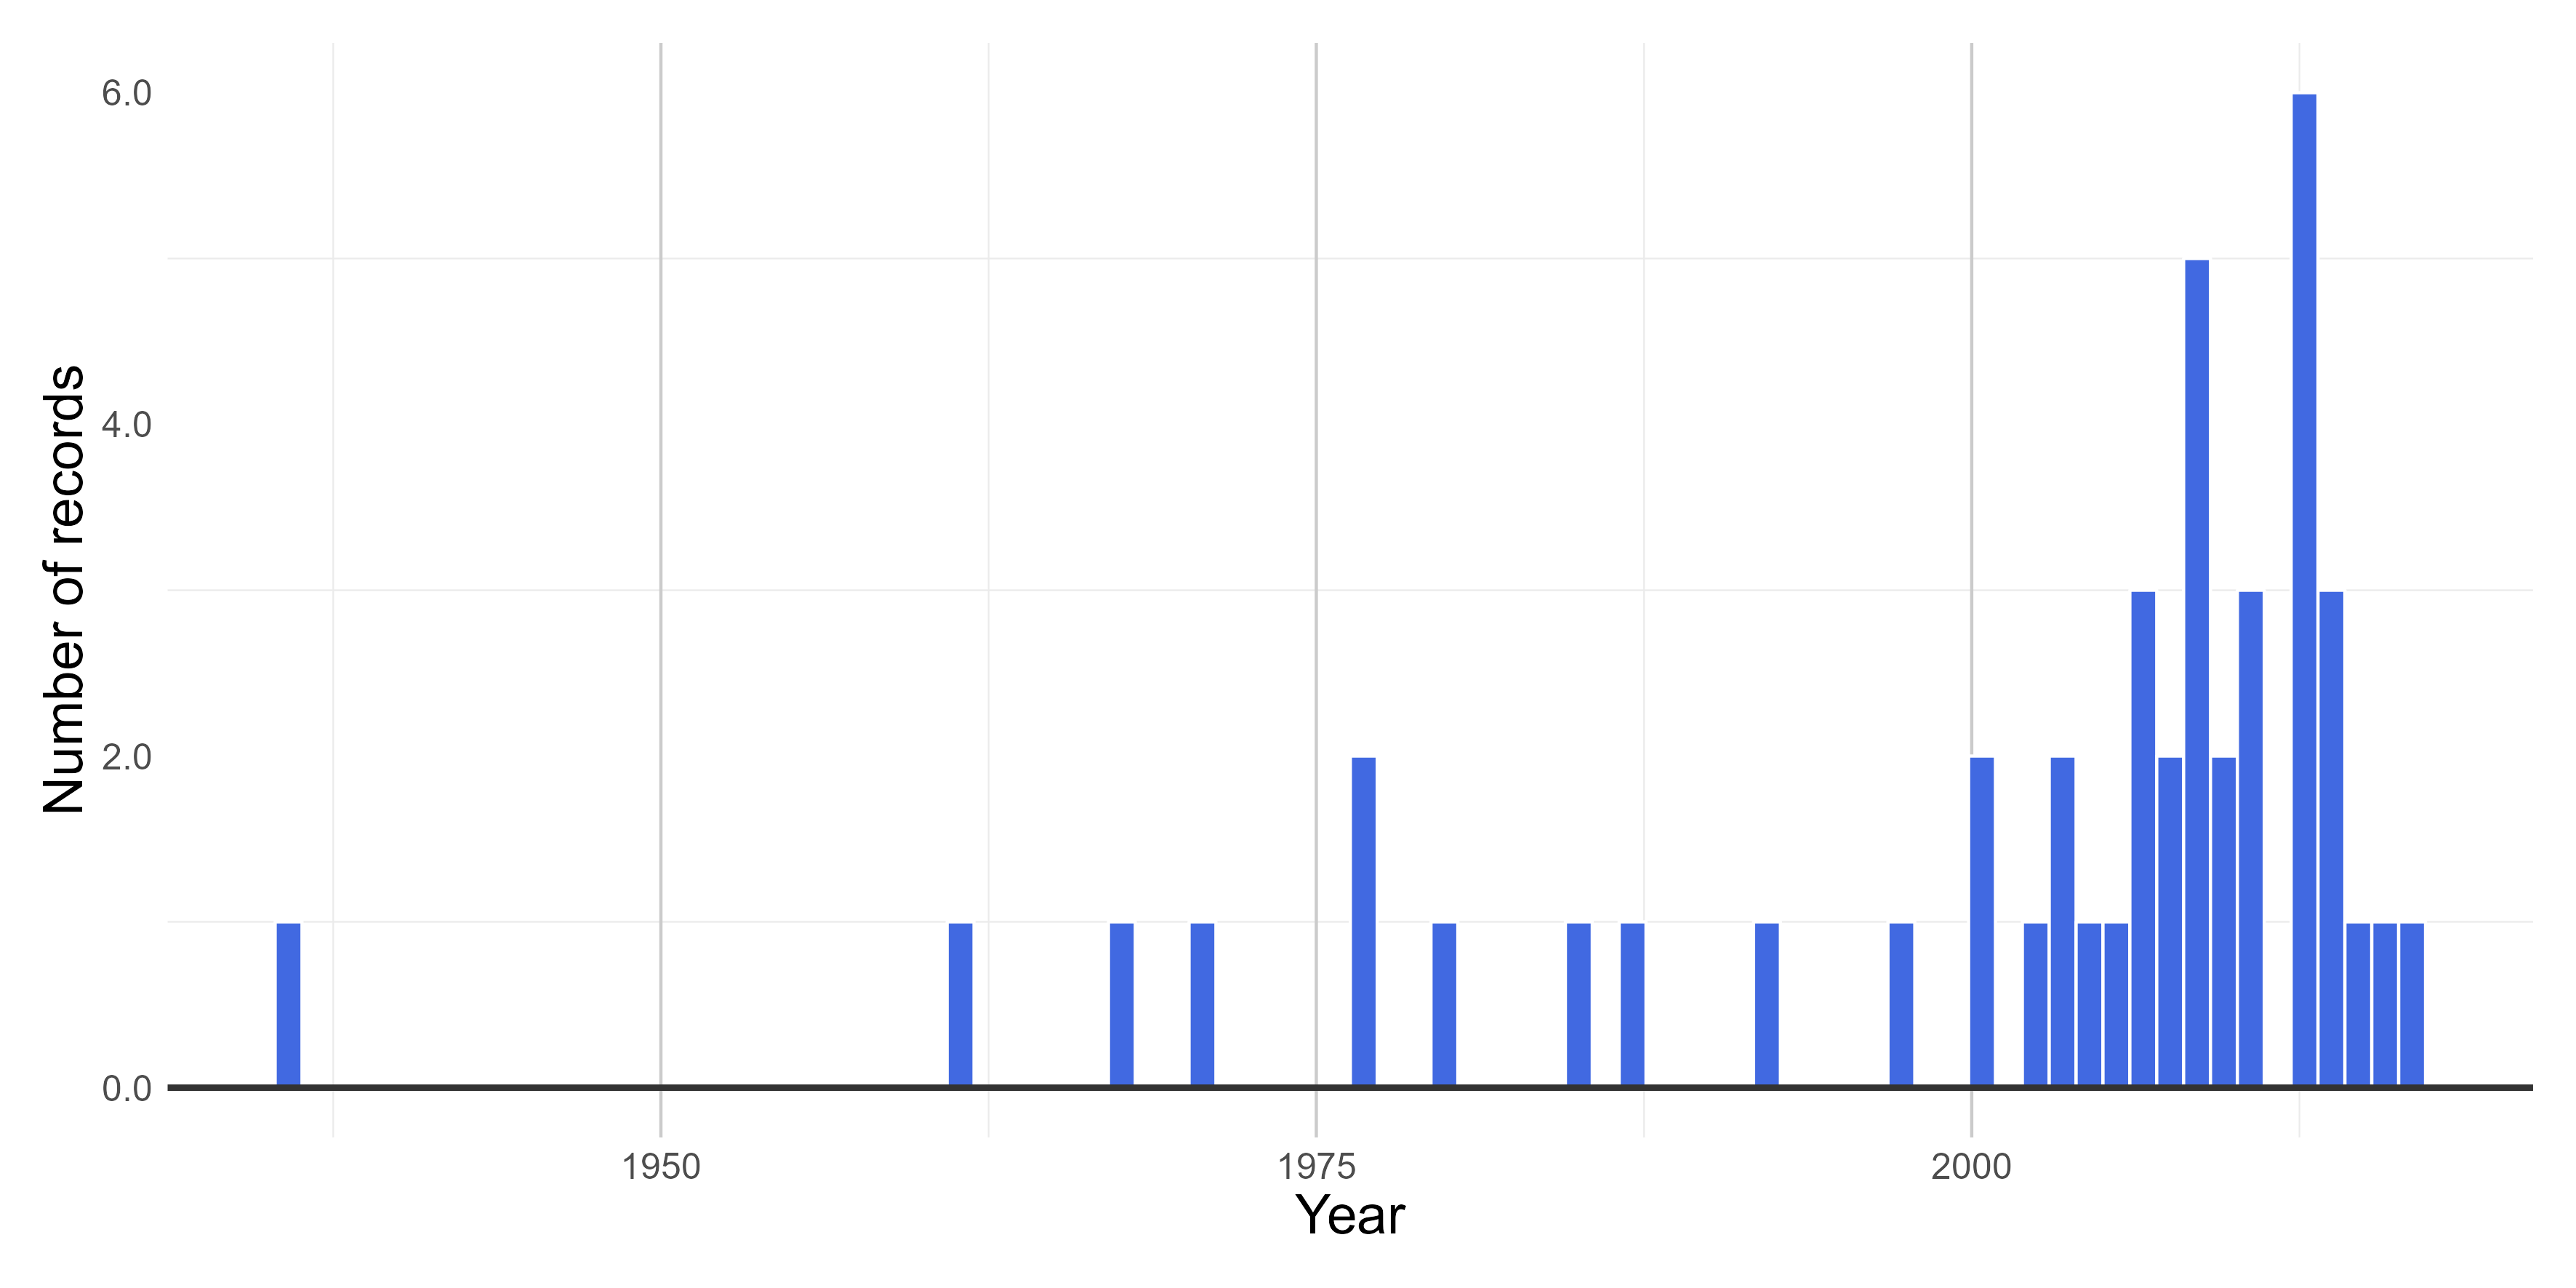
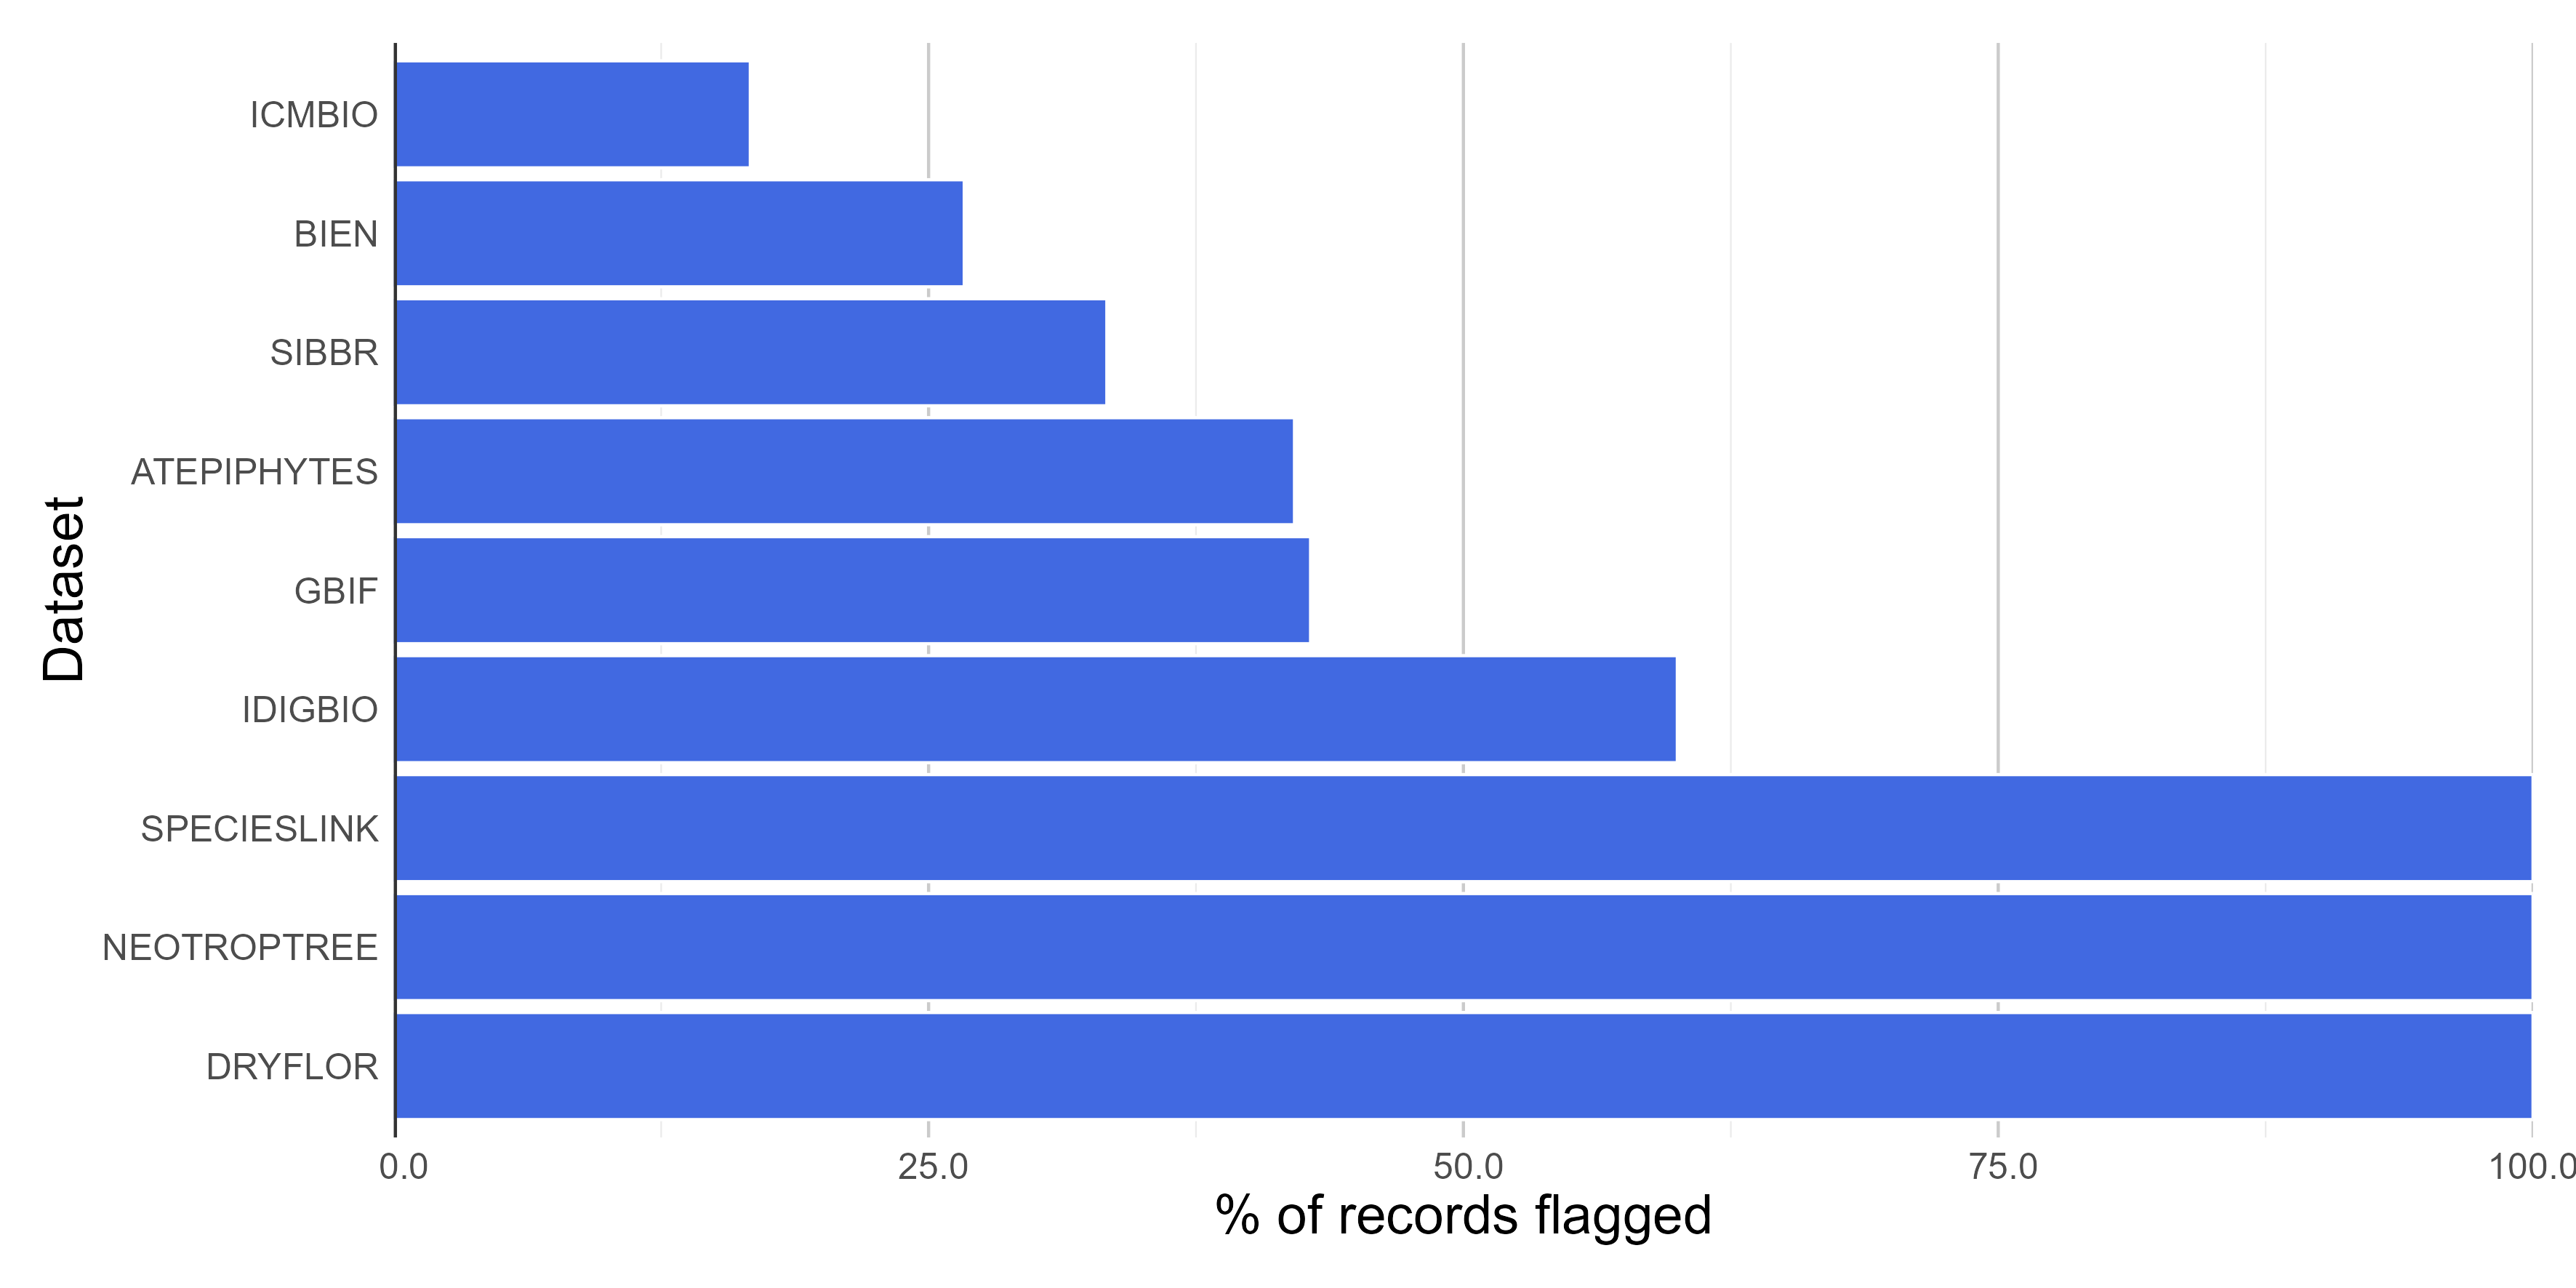
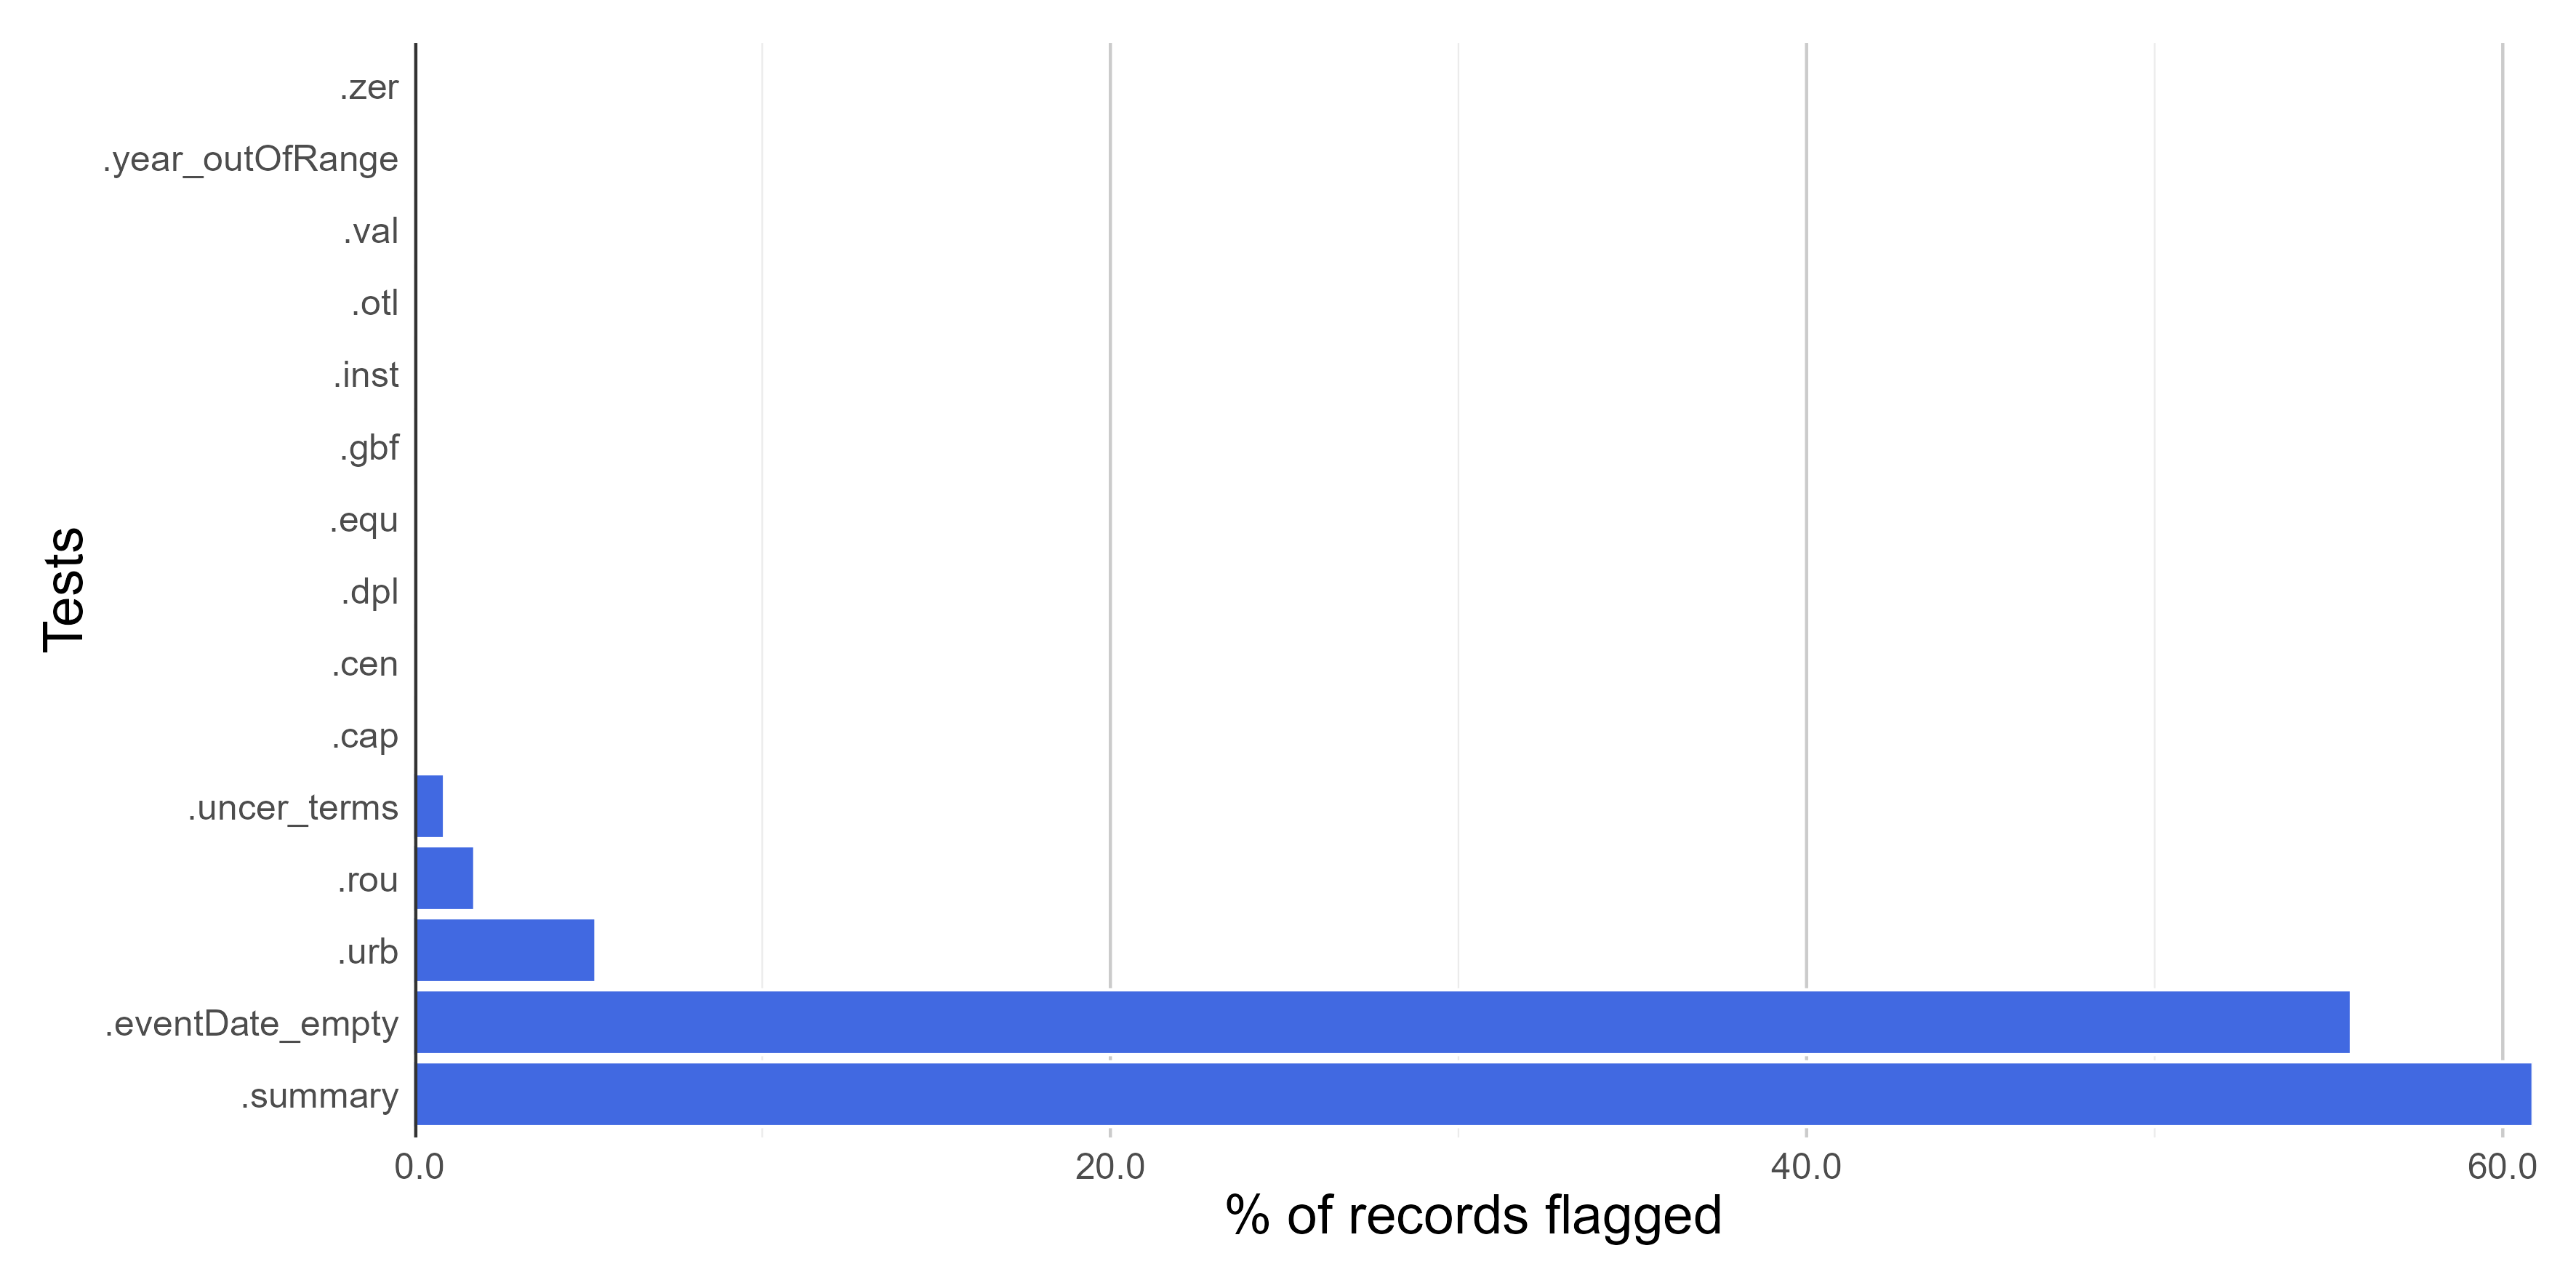
Here we create figures (bar plots and histrogram) to make the interpretation of the results of data quality tests easier. See some examples below. Figures can be automatically saved if save_figures = TRUE.
figures <-
bdc_create_figures(data = check_time,
                   database_id = "database_id",
                   workflow_step = "time",
                   save_figures = FALSE)

# Check figures using
figures$time_year_BAR


Saving a "raw" database
Save the original database containing the results of all data quality tests appended in separate columns. You can use [qs::qread()]{.underline} instead of write_csv to save a large database in a compressed format.
check_time %>%
  readr::write_csv(.,
            here::here("Output", "Intermediate", "04_time_database.csv"))
Filtering the database
Let's remove potentially erroneous or suspect records flagged by the data quality tests applied in all modules of the bdc package to get a "clean", "fitness-for-use" database. Note that 25% (45 out of 180 records) of original records were considered "fitness-for-use" after the data-cleaning process.
output <-
  check_time %>%
  dplyr::filter(.summary == TRUE) %>%
  bdc_filter_out_flags(data = ., col_to_remove = "all")
Saving a clean "fitness-for-use" database
You can use [qs::qsave()]{.underline} instead of write_csv to save a large database in a compressed format.
# use qs::qsave() to save the database in a compressed format and then qs:qread() to load the database
output %>%
  readr::write_csv(.,
            here::here("Output", "Intermediate", "05_cleaned_database.csv"))
output <-
    readr::read_csv(system.file("extdata/outpus_vignettes/05_cleaned_database.csv", package = "bdc"), show_col_types = FALSE)
DT::datatable(
  output[1:15,], class = 'stripe', extensions = 'FixedColumns',
  rownames = FALSE,
  options = list(
    pageLength = 3,
    dom = 'Bfrtip',
    scrollX = TRUE,
    fixedColumns = list(leftColumns = 2)
  )
)
brunobrr/bdc documentation built on June 11, 2025, 1:56 p.m.
knitr::opts_chunk$set( collapse = TRUE, comment = "#>", fig.path = "man/figures/README-", out.width = "100%", echo = TRUE, warning = FALSE, eval = T )
library(bdc)
Introduction
This module of the bdc package extracts the collection year whenever possible from complete and legitimate date information and flags dubious (e.g., 07/07/10), illegitimate (e.g., 1300, 2100), or not supplied (e.g., 0 or NA) collecting year.
Installation
Check here how to install the bdc package.
Reading the database
Read the database created in the Space module of the bdc package. It is also possible to read any datasets containing the **required** fields to run the function (more details here).
database <- readr::read_csv(here::here("Output/Intermediate/03_space_database.csv"))
database <- readr::read_csv(system.file("extdata/outpus_vignettes/03_space_database.csv", package = "bdc"), show_col_types = FALSE)
DT::datatable( database[1:15,], class = 'stripe', extensions = 'FixedColumns', rownames = FALSE, options = list( pageLength = 3, dom = 'Bfrtip', scrollX = TRUE, fixedColumns = list(leftColumns = 2) ) )
⚠️IMPORTANT:
The results of the VALIDATION test used to flag data quality are appended in separate fields in this database and retrieved as TRUE (✅ ok) or FALSE (❌check carefully).
1 - Records lacking event date information
VALIDATION. This function flags records lacking event date information (e.g., empty or NA).
check_time <- bdc_eventDate_empty(data = database, eventDate = "verbatimEventDate")
2 - Extract year from event date
ENRICHMENT. This function extracts four-digit years from unambiguously interpretable collecting dates.
check_time <- bdc_year_from_eventDate(data = check_time, eventDate = "verbatimEventDate")
3 - Records with out-of-range collecting year
VALIDATION. This function identifies records with illegitimate or potentially imprecise collecting years. The year provided can be out-of-range (e.g., in the future) or collected before a specified year supplied by the user (e.g., 1900). Older records are more likely to be imprecise due to the locality-derived geo-referencing process.
check_time <- bdc_year_outOfRange(data = check_time, eventDate = "year", year_threshold = 1900)
Report
Here we create a column named .summary summing up the results of all VALIDATION tests. This column is FALSE when a record is flagged as FALSE in any data quality test (❌check carefully. potentially invalid or suspect record).
check_time <- bdc_summary_col(data = check_time)
Creating a report summarizing the results of all tests of the bdc package. The report can be automatically saved if save_report = TRUE.
report <- bdc_create_report(data = check_time, database_id = "database_id", workflow_step = "time", save_report = FALSE) report
report <- readr::read_csv( system.file("extdata/outpus_vignettes/04_Report_time.csv", package = "bdc"), show_col_types = FALSE )
DT::datatable( report, class = 'stripe', extensions = 'FixedColumns', rownames = FALSE, options = list( # pageLength = 5, dom = 'Bfrtip', scrollX = TRUE, fixedColumns = list(leftColumns = 2) ) )
Figures
Here we create figures (bar plots and histrogram) to make the interpretation of the results of data quality tests easier. See some examples below. Figures can be automatically saved if save_figures = TRUE.
figures <- bdc_create_figures(data = check_time, database_id = "database_id", workflow_step = "time", save_figures = FALSE) # Check figures using figures$time_year_BAR


Saving a "raw" database
Save the original database containing the results of all data quality tests appended in separate columns. You can use [qs::qread()]{.underline} instead of write_csv to save a large database in a compressed format.
check_time %>% readr::write_csv(., here::here("Output", "Intermediate", "04_time_database.csv"))
Filtering the database
Let's remove potentially erroneous or suspect records flagged by the data quality tests applied in all modules of the bdc package to get a "clean", "fitness-for-use" database. Note that 25% (45 out of 180 records) of original records were considered "fitness-for-use" after the data-cleaning process.
output <- check_time %>% dplyr::filter(.summary == TRUE) %>% bdc_filter_out_flags(data = ., col_to_remove = "all")
Saving a clean "fitness-for-use" database
You can use [qs::qsave()]{.underline} instead of write_csv to save a large database in a compressed format.
# use qs::qsave() to save the database in a compressed format and then qs:qread() to load the database output %>% readr::write_csv(., here::here("Output", "Intermediate", "05_cleaned_database.csv"))
output <- readr::read_csv(system.file("extdata/outpus_vignettes/05_cleaned_database.csv", package = "bdc"), show_col_types = FALSE)
DT::datatable( output[1:15,], class = 'stripe', extensions = 'FixedColumns', rownames = FALSE, options = list( pageLength = 3, dom = 'Bfrtip', scrollX = TRUE, fixedColumns = list(leftColumns = 2) ) )
Add the following code to your website.
For more information on customizing the embed code, read Embedding Snippets.
