In csdaw/ggprism: A 'ggplot2' Extension Inspired by 'GraphPad Prism'
knitr::opts_chunk$set(
  echo = FALSE,
  collapse = TRUE,
  comment = "#>",
  dpi = 120,
  fig.width = 6,
  out.width = 400,
  fig.path = "man/figures/README-"
)

library(ggplot2)
library(dplyr)
library(tidyr)
library(ggprism)
library(ggnewscale)
ggprism 


The ggprism package provides various themes, palettes, and other useful
functions to customise ggplots and give them the 'GraphPad Prism' look.
Install
Install the latest version from CRAN:
install.packages("ggprism")
Install the development version from GitHub:
remotes::install_github("csdaw/ggprism")
How to Use
See the Getting Started
page for a quick overview of ggprism features.
Detailed examples and instructions can be found below and on the
ggprism website.
library(ggplot2)
library(ggprism)

tg <- ToothGrowth
tg$dose <- as.factor(tg$dose)

base <- ggplot(tg, aes(x = dose, y = len)) +
  geom_violin(aes(colour = dose, fill = dose), trim = FALSE) +
  geom_boxplot(aes(fill = dose), width = 0.2, colour = "black") +
  scale_y_continuous(limits = c(-5, 40))

p_vals <- tibble::tribble(
  ~group1, ~group2, ~p.adj,   ~y.position,
  "0.5",   "1",     8.80e-14, 35,
  "0.5",   "2",     1.27e-7,  39
)
base

base +
  scale_color_prism("floral") +
  scale_fill_prism("floral") +
  guides(y = "prism_offset_minor") +
  theme_prism(base_size = 16) +
  theme(legend.position = "none") +
  add_pvalue(p_vals, label = "p = {p.adj}", tip.length = 0, label.size = 4)
Feedback and Contributions
Any feedback, questions, and suggestions are welcome and should be
shared via GitHub discussions.
Bug reports should be submitted via
GitHub issues
with a minimal reproducible example, e.g. using the
reprex package.
Contributions to ggprism are also welcome and pull requires should also be
submitted via GitHub issues.
Please fork/clone this repository and create a new branch to develop
your contribution in. Some ways to contribute might include:
- Updates and corrections to documentation
- Examples and vignettes for existing functions
- Bug fixes
- New functions with associated documentation, examples, and tests
Cite
I would be very grateful if you could cite this package if you use it in your
publication:
Charlotte Dawson (r format(Sys.Date(), "%Y")).
ggprism: A 'ggplot2' Extension Inspired by 'GraphPad Prism'. R package version
r getNamespaceVersion("ggprism"). https://cran.r-project.org/package=ggprism
doi: 10.5281/zenodo.4556067
# BibTex for LaTeX users
@Manual{
title = {ggprism: A 'ggplot2' Extension Inspired by 'GraphPad Prism'},
author = {Charlotte Dawson},
year = {`r format(Sys.Date(), "%Y")`},
note = {R package version `r getNamespaceVersion("ggprism")`},
url = {https://cran.r-project.org/package=ggprism},
doi = {10.5281/zenodo.4556067}
}
More Examples
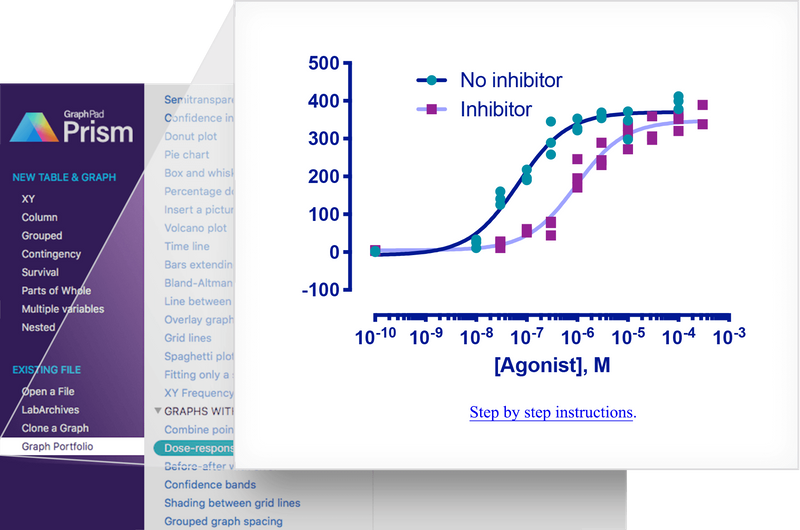
Recreates this figure
from the GraphPad Prism website. See
this vignette for the
source code and step-by-step instructions.
df <- data.frame(
  agonist = c(1e-10, 1e-8, 3e-8, 1e-7, 3e-7, 1e-6, 3e-6, 1e-5, 3e-5, 1e-4, 3e-4),
  ctr1 = c(0, 11, 125, 190, 258, 322, 354, 348, NA, 412, NA),
  ctr2 = c(3, 33, 141, 218, 289, 353, 359, 298, NA, 378, NA),
  ctr3 = c(2, 25, 160, 196, 345, 328, 369, 372, NA, 399, NA),
  trt1 = c(3, NA, 11, 52, 80, 171, 289, 272, 359, 352, 389),
  trt2 = c(5, NA, 25, 55, 77, 195, 230, 333, 306, 320, 338),
  trt3 = c(4, NA, 28, 61, 44, 246, 243, 310, 297, 365, NA)
) %>%
  mutate(log.agonist = log10(agonist)) %>%
  pivot_longer(
    c(-agonist, -log.agonist),
    names_pattern = "(.{3})([0-9])", names_to = c("treatment", "rep")
  ) %>%
  filter(!is.na(value))

dr_eq <- y ~ min + ((max - min) / (1 + 10^(ec50 - (x))))
# Before
ggplot(df, aes(x = log.agonist, y = value, colour = treatment, shape = treatment)) +
  geom_point() +
  geom_smooth(
    method = "nls", formula = dr_eq, se = FALSE,
    method.args = list(start = list(min = 1.67, max = 397, ec50 = -7))
  ) +
  scale_x_continuous(
    limits = c(-10, -3), breaks = -10:-3,
    minor_breaks = log10(rep(1:9, 7)*(10^rep(-10:-4, each = 9)))
  ) +
  scale_y_continuous(limits = c(-100, 500), breaks = seq(-100, 500, 100)) +
  theme_grey(base_size = 11) +
  scale_colour_discrete(labels = c("No inhibitor", "Inhibitor")) +
  scale_shape_discrete(labels = c("No inhibitor", "Inhibitor")) +
  guides(
    colour = guide_legend(position = "inside"),
    shape = guide_legend(position = "inside")
  ) +
  theme(
    axis.title.y = element_blank(),
    legend.title = element_blank(),
    legend.position.inside = c(0.05, 0.95),
    legend.justification = c(0.05, 0.95)
  ) +
  labs(x = "[Agonist], M")

# After
exp_bold <- function(lab) {
  do.call(
    expression,
    lapply(paste(lab), function(x) bquote(bold("10"^.(x))))
  )
}

ggplot(df, aes(x = log.agonist, y = value)) +
  geom_smooth(
    aes(colour = treatment),
    method = "nls", formula = dr_eq, se = FALSE,
    method.args = list(start = list(min = 1.67, max = 397, ec50 = -7)),
    show.legend = TRUE
  ) +
  scale_colour_manual(
    name = "treatment",
    labels = c("No inhibitor", "Inhibitor"),
    values = c("#00167B", "#9FA3FE")
  ) +
  scale_x_continuous(
    limits = c(-10, -3), breaks = -10:-3,
    minor_breaks = log10(rep(1:9, 7)*(10^rep(-10:-4, each = 9))),
    labels = exp_bold,
    guide = "prism_offset_minor"
  ) +
  scale_y_continuous(
    limits = c(-100, 500), breaks = seq(-100, 500, 100),
    guide = "prism_offset"
  ) +
  guides(colour = guide_legend(position = "inside")) +
  new_scale_colour() +
  geom_point(aes(colour = treatment, shape = treatment), size = 3) +
  scale_colour_prism(
    "winter_bright",
    name = "treatment", labels = c("No inhibitor", "Inhibitor")
  ) +
  scale_shape_prism(name = "treatment", labels = c("No inhibitor", "Inhibitor")) +
  guides(
    colour = guide_legend(position = "inside"),
    shape = guide_legend(position = "inside")
  ) +
  theme_prism("winter_bright", base_size = 16) +
  theme(
    axis.title.y = element_blank(),
    legend.title = element_blank(),
    legend.position.inside = c(0.05, 0.95),
    legend.justification = c(0.05, 0.95)
  ) +
  labs(x = "[Agonist], M")
Recreates Figure 2B from
Matsushita & Nishimura (2020),
which was originally created using GraphPad Prism. See
this vignette for the
source code and step-by-step instructions.
df2 <- wings %>%
  mutate(measure = stringr::str_to_title(measure))

wings.pvals <- df2 %>%
  group_by(sex, measure) %>%
  rstatix::t_test(percent.change ~ genotype, p.adjust.method = "BH", var.equal = TRUE, ref.group = "Tps1MIC/+") %>%
  rstatix::add_x_position(x = "measure", dodge = 0.9) %>%
  mutate(label = c("***", "*", "P = 0.26", "***", "***", "P = 0.65"))
# Before
ggplot(df2, aes(
  x = factor(measure, levels = c("Wing.size", "Cell.size", "Cell.number")),
  y = percent.change)
) +
  ggbeeswarm::geom_beeswarm(
    aes(fill = genotype),
    dodge.width = 0.9,
    #spacing = 1.6,
    shape = 21
  ) +
  scale_y_continuous(
    limits = c(-20, 12),
    expand = c(0, 0),
    breaks = seq(-20, 10, 5)
  ) +
  scale_x_discrete(
    labels = function(x) stringr::str_wrap(gsub("\\.", " ", x), width = 5)
  ) +
  facet_wrap(
    ~ sex,
    scales = "free",
    labeller = labeller(sex = c(male = "\u2642", female = "\u2640"))
  ) +
  scale_fill_manual(
    values = c("#026FEE", "#87FFFF"),
    labels = c(expression("Tps"*1^italic("MIC")~"/ +"), expression("Tps"*1^italic("MIC")))
  ) +
  labs(y = "% change") +
  theme(
    legend.position = "bottom",
    axis.title.x = element_blank(),
    strip.text = element_text(size = 14),
    legend.spacing.x = unit(0, "pt"),
    legend.text = element_text(margin = margin(r = 20))
  ) +
  geom_hline(yintercept = 0, linetype = 2, linewidth = 0.3) +
  stat_summary(
    geom = "crossbar",
    aes(fill = genotype),
    fun = mean,
    position = position_dodge(0.9),
    colour = "red",
    linewidth = 0.4, width = 0.7,
    show.legend = FALSE
  ) +
  geom_text(
    data = data.frame(
      sex = factor("female", levels = c("male", "female")),
      measure = "Cell.number",
      percent.change = -18.5,
      lab = "(n = 10)"
    ),
    aes(label = lab)
  ) +
  guides(fill = guide_legend(override.aes = list(size=3)))

# After
ggplot(df2, aes(
  x = factor(measure, levels = c("Wing.size", "Cell.size", "Cell.number")),
  y = percent.change)
) +
  ggbeeswarm::geom_beeswarm(
    aes(fill = genotype),
    dodge.width = 0.9,
    #spacing = 1.6,
    shape = 21
  ) +
  scale_y_continuous(
    limits = c(-20, 12),
    expand = c(0, 0),
    breaks = seq(-20, 10, 5),
    guide = "prism_offset"
  ) +
  scale_x_discrete(
    guide = guide_prism_bracket(width = 0.15),
    labels = function(x) stringr::str_wrap(gsub("\\.", " ", x), width = 5)
  ) +
  facet_wrap(
    ~ sex,
    scales = "free",
    labeller = labeller(sex = c(male = "\u2642", female = "\u2640"))
  ) +
  theme_prism(base_fontface = "plain", base_line_size = 0.7, base_family = "Arial") +
  scale_fill_manual(
    values = c("#026FEE", "#87FFFF"),
    labels = c(expression("Tps"*1^italic("MIC")~"/ +"), expression("Tps"*1^italic("MIC")))
  ) +
  labs(y = "% change") +
  theme(
    legend.position = "bottom",
    axis.title.x = element_blank(),
    strip.text = element_text(size = 14),
    legend.spacing.x = unit(0, "pt"),
    legend.text = element_text(margin = margin(r = 20))
  ) +
  geom_hline(yintercept = 0, linetype = 2, linewidth = 0.3) +
  stat_summary(
    geom = "crossbar",
    aes(fill = genotype),
    fun = mean,
    position = position_dodge(0.9),
    colour = "red",
    linewidth = 0.4, width = 0.7,
    show.legend = FALSE
  ) +
  add_pvalue(
    wings.pvals, y = 10, xmin = "xmin", xmax = "xmax", tip.length = 0,
    fontface = "italic", lineend = "round", bracket.size = 0.5
  ) +
  geom_text(
    data = data.frame(
      sex = factor("female", levels = c("male", "female")),
      measure = "Cell.number",
      percent.change = -18.5,
      lab = "(n = 10)"
    ),
    aes(label = lab)
  ) +
  guides(fill = guide_legend(override.aes = list(size=3)))
csdaw/ggprism documentation built on June 15, 2025, 6:27 a.m.
R Package Documentation
Browse R Packages
We want your feedback!
Note that we can't provide technical support on individual packages. You should contact the package authors for that.
knitr::opts_chunk$set( echo = FALSE, collapse = TRUE, comment = "#>", dpi = 120, fig.width = 6, out.width = 400, fig.path = "man/figures/README-" ) library(ggplot2) library(dplyr) library(tidyr) library(ggprism) library(ggnewscale)
ggprism
![]()
![]()
![]()
The ggprism package provides various themes, palettes, and other useful
functions to customise ggplots and give them the 'GraphPad Prism' look.
Install
Install the latest version from CRAN:
install.packages("ggprism")
Install the development version from GitHub:
remotes::install_github("csdaw/ggprism")
How to Use
See the Getting Started
page for a quick overview of ggprism features.
Detailed examples and instructions can be found below and on the
ggprism website.
library(ggplot2) library(ggprism) tg <- ToothGrowth tg$dose <- as.factor(tg$dose) base <- ggplot(tg, aes(x = dose, y = len)) + geom_violin(aes(colour = dose, fill = dose), trim = FALSE) + geom_boxplot(aes(fill = dose), width = 0.2, colour = "black") + scale_y_continuous(limits = c(-5, 40)) p_vals <- tibble::tribble( ~group1, ~group2, ~p.adj, ~y.position, "0.5", "1", 8.80e-14, 35, "0.5", "2", 1.27e-7, 39 )
base base + scale_color_prism("floral") + scale_fill_prism("floral") + guides(y = "prism_offset_minor") + theme_prism(base_size = 16) + theme(legend.position = "none") + add_pvalue(p_vals, label = "p = {p.adj}", tip.length = 0, label.size = 4)
Feedback and Contributions
Any feedback, questions, and suggestions are welcome and should be shared via GitHub discussions.
Bug reports should be submitted via
GitHub issues
with a minimal reproducible example, e.g. using the
reprex package.
Contributions to ggprism are also welcome and pull requires should also be
submitted via GitHub issues.
Please fork/clone this repository and create a new branch to develop
your contribution in. Some ways to contribute might include:
- Updates and corrections to documentation
- Examples and vignettes for existing functions
- Bug fixes
- New functions with associated documentation, examples, and tests
Cite
I would be very grateful if you could cite this package if you use it in your publication:
Charlotte Dawson (r format(Sys.Date(), "%Y")).
ggprism: A 'ggplot2' Extension Inspired by 'GraphPad Prism'. R package version
r getNamespaceVersion("ggprism"). https://cran.r-project.org/package=ggprism
doi: 10.5281/zenodo.4556067
# BibTex for LaTeX users
@Manual{
title = {ggprism: A 'ggplot2' Extension Inspired by 'GraphPad Prism'},
author = {Charlotte Dawson},
year = {`r format(Sys.Date(), "%Y")`},
note = {R package version `r getNamespaceVersion("ggprism")`},
url = {https://cran.r-project.org/package=ggprism},
doi = {10.5281/zenodo.4556067}
}
More Examples
Recreates this figure from the GraphPad Prism website. See this vignette for the source code and step-by-step instructions.
df <- data.frame( agonist = c(1e-10, 1e-8, 3e-8, 1e-7, 3e-7, 1e-6, 3e-6, 1e-5, 3e-5, 1e-4, 3e-4), ctr1 = c(0, 11, 125, 190, 258, 322, 354, 348, NA, 412, NA), ctr2 = c(3, 33, 141, 218, 289, 353, 359, 298, NA, 378, NA), ctr3 = c(2, 25, 160, 196, 345, 328, 369, 372, NA, 399, NA), trt1 = c(3, NA, 11, 52, 80, 171, 289, 272, 359, 352, 389), trt2 = c(5, NA, 25, 55, 77, 195, 230, 333, 306, 320, 338), trt3 = c(4, NA, 28, 61, 44, 246, 243, 310, 297, 365, NA) ) %>% mutate(log.agonist = log10(agonist)) %>% pivot_longer( c(-agonist, -log.agonist), names_pattern = "(.{3})([0-9])", names_to = c("treatment", "rep") ) %>% filter(!is.na(value)) dr_eq <- y ~ min + ((max - min) / (1 + 10^(ec50 - (x))))
# Before ggplot(df, aes(x = log.agonist, y = value, colour = treatment, shape = treatment)) + geom_point() + geom_smooth( method = "nls", formula = dr_eq, se = FALSE, method.args = list(start = list(min = 1.67, max = 397, ec50 = -7)) ) + scale_x_continuous( limits = c(-10, -3), breaks = -10:-3, minor_breaks = log10(rep(1:9, 7)*(10^rep(-10:-4, each = 9))) ) + scale_y_continuous(limits = c(-100, 500), breaks = seq(-100, 500, 100)) + theme_grey(base_size = 11) + scale_colour_discrete(labels = c("No inhibitor", "Inhibitor")) + scale_shape_discrete(labels = c("No inhibitor", "Inhibitor")) + guides( colour = guide_legend(position = "inside"), shape = guide_legend(position = "inside") ) + theme( axis.title.y = element_blank(), legend.title = element_blank(), legend.position.inside = c(0.05, 0.95), legend.justification = c(0.05, 0.95) ) + labs(x = "[Agonist], M") # After exp_bold <- function(lab) { do.call( expression, lapply(paste(lab), function(x) bquote(bold("10"^.(x)))) ) } ggplot(df, aes(x = log.agonist, y = value)) + geom_smooth( aes(colour = treatment), method = "nls", formula = dr_eq, se = FALSE, method.args = list(start = list(min = 1.67, max = 397, ec50 = -7)), show.legend = TRUE ) + scale_colour_manual( name = "treatment", labels = c("No inhibitor", "Inhibitor"), values = c("#00167B", "#9FA3FE") ) + scale_x_continuous( limits = c(-10, -3), breaks = -10:-3, minor_breaks = log10(rep(1:9, 7)*(10^rep(-10:-4, each = 9))), labels = exp_bold, guide = "prism_offset_minor" ) + scale_y_continuous( limits = c(-100, 500), breaks = seq(-100, 500, 100), guide = "prism_offset" ) + guides(colour = guide_legend(position = "inside")) + new_scale_colour() + geom_point(aes(colour = treatment, shape = treatment), size = 3) + scale_colour_prism( "winter_bright", name = "treatment", labels = c("No inhibitor", "Inhibitor") ) + scale_shape_prism(name = "treatment", labels = c("No inhibitor", "Inhibitor")) + guides( colour = guide_legend(position = "inside"), shape = guide_legend(position = "inside") ) + theme_prism("winter_bright", base_size = 16) + theme( axis.title.y = element_blank(), legend.title = element_blank(), legend.position.inside = c(0.05, 0.95), legend.justification = c(0.05, 0.95) ) + labs(x = "[Agonist], M")
Recreates Figure 2B from Matsushita & Nishimura (2020), which was originally created using GraphPad Prism. See this vignette for the source code and step-by-step instructions.
df2 <- wings %>% mutate(measure = stringr::str_to_title(measure)) wings.pvals <- df2 %>% group_by(sex, measure) %>% rstatix::t_test(percent.change ~ genotype, p.adjust.method = "BH", var.equal = TRUE, ref.group = "Tps1MIC/+") %>% rstatix::add_x_position(x = "measure", dodge = 0.9) %>% mutate(label = c("***", "*", "P = 0.26", "***", "***", "P = 0.65"))
# Before ggplot(df2, aes( x = factor(measure, levels = c("Wing.size", "Cell.size", "Cell.number")), y = percent.change) ) + ggbeeswarm::geom_beeswarm( aes(fill = genotype), dodge.width = 0.9, #spacing = 1.6, shape = 21 ) + scale_y_continuous( limits = c(-20, 12), expand = c(0, 0), breaks = seq(-20, 10, 5) ) + scale_x_discrete( labels = function(x) stringr::str_wrap(gsub("\\.", " ", x), width = 5) ) + facet_wrap( ~ sex, scales = "free", labeller = labeller(sex = c(male = "\u2642", female = "\u2640")) ) + scale_fill_manual( values = c("#026FEE", "#87FFFF"), labels = c(expression("Tps"*1^italic("MIC")~"/ +"), expression("Tps"*1^italic("MIC"))) ) + labs(y = "% change") + theme( legend.position = "bottom", axis.title.x = element_blank(), strip.text = element_text(size = 14), legend.spacing.x = unit(0, "pt"), legend.text = element_text(margin = margin(r = 20)) ) + geom_hline(yintercept = 0, linetype = 2, linewidth = 0.3) + stat_summary( geom = "crossbar", aes(fill = genotype), fun = mean, position = position_dodge(0.9), colour = "red", linewidth = 0.4, width = 0.7, show.legend = FALSE ) + geom_text( data = data.frame( sex = factor("female", levels = c("male", "female")), measure = "Cell.number", percent.change = -18.5, lab = "(n = 10)" ), aes(label = lab) ) + guides(fill = guide_legend(override.aes = list(size=3))) # After ggplot(df2, aes( x = factor(measure, levels = c("Wing.size", "Cell.size", "Cell.number")), y = percent.change) ) + ggbeeswarm::geom_beeswarm( aes(fill = genotype), dodge.width = 0.9, #spacing = 1.6, shape = 21 ) + scale_y_continuous( limits = c(-20, 12), expand = c(0, 0), breaks = seq(-20, 10, 5), guide = "prism_offset" ) + scale_x_discrete( guide = guide_prism_bracket(width = 0.15), labels = function(x) stringr::str_wrap(gsub("\\.", " ", x), width = 5) ) + facet_wrap( ~ sex, scales = "free", labeller = labeller(sex = c(male = "\u2642", female = "\u2640")) ) + theme_prism(base_fontface = "plain", base_line_size = 0.7, base_family = "Arial") + scale_fill_manual( values = c("#026FEE", "#87FFFF"), labels = c(expression("Tps"*1^italic("MIC")~"/ +"), expression("Tps"*1^italic("MIC"))) ) + labs(y = "% change") + theme( legend.position = "bottom", axis.title.x = element_blank(), strip.text = element_text(size = 14), legend.spacing.x = unit(0, "pt"), legend.text = element_text(margin = margin(r = 20)) ) + geom_hline(yintercept = 0, linetype = 2, linewidth = 0.3) + stat_summary( geom = "crossbar", aes(fill = genotype), fun = mean, position = position_dodge(0.9), colour = "red", linewidth = 0.4, width = 0.7, show.legend = FALSE ) + add_pvalue( wings.pvals, y = 10, xmin = "xmin", xmax = "xmax", tip.length = 0, fontface = "italic", lineend = "round", bracket.size = 0.5 ) + geom_text( data = data.frame( sex = factor("female", levels = c("male", "female")), measure = "Cell.number", percent.change = -18.5, lab = "(n = 10)" ), aes(label = lab) ) + guides(fill = guide_legend(override.aes = list(size=3)))
R Package Documentation
Browse R Packages
We want your feedback!
Note that we can't provide technical support on individual packages. You should contact the package authors for that.
Embedding an R snippet on your website
Add the following code to your website.
For more information on customizing the embed code, read Embedding Snippets.