README.md
In csetraynor/iclust2prog: Prognostic modeling of IntClust-2 (iclust2prog)
Package iclust2prog
iclust2prog
This package includes relevant code and figures of various prognostic models in iClust2-patients from the METABRIC trial.
A recent breakthrough in breast cancer has stratified the METABRIC cohort (Pereira et al) using integrative clustering confirming
that there are at least 10 subtypes of the disease which have different clinical outcome. Depending on
the category patients may be spared unnecessary chemotherapy or benefit of targeted antibody HER-2 therapy
(intClust-3 and intClust-5, respectively). Moreover, it is established that intClust-2 (currently into ER-positive)
has poor prognosis. In this study, we revisit the (Pereira et al) dataset, downloaded via the
cBioPortal platform (Gao et al), to describe a novel gene signature predictive of prognosis in intClust-2 patients, with the
potential to develop new tailored therapies by mapping genes to pathological pathways.
Prerequisites
This package is built in R to install R follow R-CRAN.
In addition, this package performs Bayesian analysis based on the HMC with Stan. Installation and documentation of Stan can be found here: http://mc-stan.org/users/documentation/ . We will be using the version for R rstan.
Installing
The R package can be installed either via git clone, see tutorial here (https://bit.ly/2MgUPIu) or by using devtools in Rstudio:
if(!require("devtools")) install.packages("devtools")
devtools::install_github("csetraynor/iclust2prog")
Getting Started
The vignette explains how to perform MC-cross-validation in survival analysis, which is very appealing in Machine Learning (McLachlan, G., 2004) and has been proposed as an alternative to classical statistical analysis ( Benavoli et al, 2017)
The dataset we are going to work with contains curated clinical outcomes and genomic (gene expression and CNA) features from the METABRIC trial.
You will be able to download the dataset via the cBioPortal and this is made easy with the introduction of the cgdsr package.
For example:
library(cgdsr)
mycgds = CGDS("http://www.cbioportal.org/public-portal/")

the_study_list = getCancerStudies(mycgds)[25,1]
case_list = getCaseLists(mycgds, the_study_list)[2,1]
clinical_data <-  getClinicalData(mycgds, case_list)
Otherwise, the data which will be relevant for this study is also included in this package:
library(iclust2prog)

###Load data

data("intclustdat")
?intclustdat
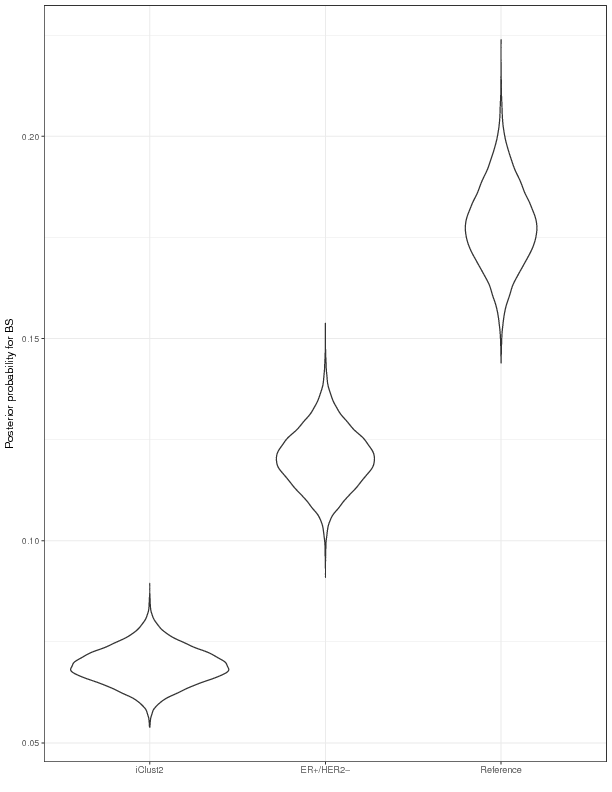
The vignette Model_comparision.R serves as an approach to the modeling of high-dimensional genomic data in survival analysis. We can, for example, learn which model selection strategy has a superior performance by comparing the integrated brier score. In addition, we can perform a post-hoc analysis and by HMC sample draws from the posterior distribution of BS. The figure below shows the empirical distribution of 100-mc-cross-validation experiment for iclust2 and ER+/HER2-.
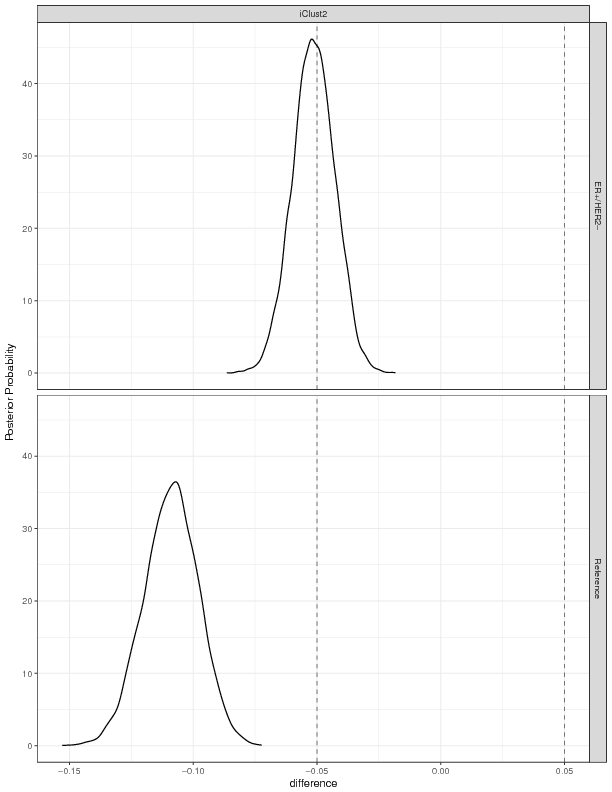
In Bayesian analysis quantify the statistical differences between models, e.g. whether the model is better or worse than the competitors is shown by the Region of Practical Equivalence (ROPE). The plot below depicts the ROPE for the comparison of the models.
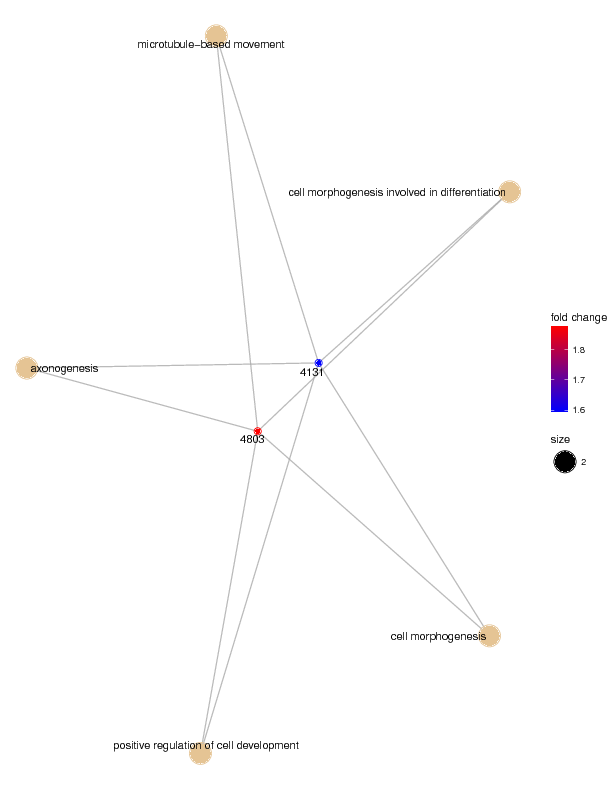
The Bioconductor package clusterProfiler (Guangchuang Yu et al) allows for visualising biological pathways which the predictors might be involved.
Acknowledgment
I would like to thank my supervisors Prof Michael Chappell,
Dr Neil Evans, Dr Tarj Sahota and Ms Helen Tomkinson for giving me the opportunity to study for this PhD at University of Warwick.
In addition, many thanks to the original authors of the study METABRIC (Pereira et al) and the creators of cBioPortal (Gao et al) for making easier to share knowledge in biology and promote the development of science that may find cures for the difficult cancerous diseases.
References
Pereira, Bernard, et al. "The somatic mutation profiles of 2,433 breast
cancers refine their genomic and transcriptomic landscapes."
Nature communications 7 (2016): 11479.
Gao, Jianjiong, et al. "Integrative analysis of complex cancer genomics
and clinical profiles using the cBioPortal."
Sci. Signal. 6.269 (2013): pl1-pl1.
Noah Simon, Jerome Friedman, Trevor Hastie, Rob Tibshirani (2011).
Regularization Paths for Cox's Proportional Hazards Model via
Coordinate Descent. Journal of Statistical Software, 39(5), 1-13. URL
http://www.jstatsoft.org/v39/i05/.
Ulla B. Mogensen, Hemant Ishwaran, Thomas A. Gerds (2012). Evaluating
Random Forests for Survival Analysis Using Prediction Error Curves.
Journal of Statistical Software, 50(11), 1-23. URL
http://www.jstatsoft.org/v50/i11/.
Max Kuhn and Hadley Wickham (2017). rsample: General Resampling
Infrastructure. R package version 0.0.2.
https://CRAN.R-project.org/package=rsample
Liang Li, Cai Wu Department of Biostatistics and The University of Texas MD
Anderson Cancer Center (2016). tdROC: Nonparametric Estimation of
Time-Dependent ROC Curve from Right Censored Survival Data. R package version
1.0. https://CRAN.R-project.org/package=tdROC
Guangchuang Yu, Li-Gen Wang, Yanyan Han and Qing-Yu He. clusterProfiler: an R
package for comparing biological themes among gene clusters. OMICS: A Journal
of Integrative Biology 2012, 16(5):284-287
McLachlan, G. Discriminant analysis and statistical pattern recognition. 544, (John Wiley & Sons, 2004).
csetraynor/iclust2prog documentation built on May 7, 2019, 8:38 a.m.
R Package Documentation
Browse R Packages
We want your feedback!
Note that we can't provide technical support on individual packages. You should contact the package authors for that.
Package iclust2prog
iclust2prog
This package includes relevant code and figures of various prognostic models in iClust2-patients from the METABRIC trial. A recent breakthrough in breast cancer has stratified the METABRIC cohort (Pereira et al) using integrative clustering confirming that there are at least 10 subtypes of the disease which have different clinical outcome. Depending on the category patients may be spared unnecessary chemotherapy or benefit of targeted antibody HER-2 therapy (intClust-3 and intClust-5, respectively). Moreover, it is established that intClust-2 (currently into ER-positive) has poor prognosis. In this study, we revisit the (Pereira et al) dataset, downloaded via the cBioPortal platform (Gao et al), to describe a novel gene signature predictive of prognosis in intClust-2 patients, with the potential to develop new tailored therapies by mapping genes to pathological pathways.
Prerequisites
This package is built in R to install R follow R-CRAN.
In addition, this package performs Bayesian analysis based on the HMC with Stan. Installation and documentation of Stan can be found here: http://mc-stan.org/users/documentation/ . We will be using the version for R rstan.
Installing
The R package can be installed either via git clone, see tutorial here (https://bit.ly/2MgUPIu) or by using devtools in Rstudio:
if(!require("devtools")) install.packages("devtools")
devtools::install_github("csetraynor/iclust2prog")
Getting Started
The vignette explains how to perform MC-cross-validation in survival analysis, which is very appealing in Machine Learning (McLachlan, G., 2004) and has been proposed as an alternative to classical statistical analysis ( Benavoli et al, 2017) The dataset we are going to work with contains curated clinical outcomes and genomic (gene expression and CNA) features from the METABRIC trial. You will be able to download the dataset via the cBioPortal and this is made easy with the introduction of the cgdsr package. For example:
library(cgdsr)
mycgds = CGDS("http://www.cbioportal.org/public-portal/")
the_study_list = getCancerStudies(mycgds)[25,1]
case_list = getCaseLists(mycgds, the_study_list)[2,1]
clinical_data <- getClinicalData(mycgds, case_list)
Otherwise, the data which will be relevant for this study is also included in this package:
library(iclust2prog)
###Load data
data("intclustdat")
?intclustdat
The vignette Model_comparision.R serves as an approach to the modeling of high-dimensional genomic data in survival analysis. We can, for example, learn which model selection strategy has a superior performance by comparing the integrated brier score. In addition, we can perform a post-hoc analysis and by HMC sample draws from the posterior distribution of BS. The figure below shows the empirical distribution of 100-mc-cross-validation experiment for iclust2 and ER+/HER2-.
In Bayesian analysis quantify the statistical differences between models, e.g. whether the model is better or worse than the competitors is shown by the Region of Practical Equivalence (ROPE). The plot below depicts the ROPE for the comparison of the models.
The Bioconductor package clusterProfiler (Guangchuang Yu et al) allows for visualising biological pathways which the predictors might be involved.
Acknowledgment
I would like to thank my supervisors Prof Michael Chappell, Dr Neil Evans, Dr Tarj Sahota and Ms Helen Tomkinson for giving me the opportunity to study for this PhD at University of Warwick.
In addition, many thanks to the original authors of the study METABRIC (Pereira et al) and the creators of cBioPortal (Gao et al) for making easier to share knowledge in biology and promote the development of science that may find cures for the difficult cancerous diseases.
References
Pereira, Bernard, et al. "The somatic mutation profiles of 2,433 breast cancers refine their genomic and transcriptomic landscapes." Nature communications 7 (2016): 11479.
Gao, Jianjiong, et al. "Integrative analysis of complex cancer genomics and clinical profiles using the cBioPortal." Sci. Signal. 6.269 (2013): pl1-pl1.
Noah Simon, Jerome Friedman, Trevor Hastie, Rob Tibshirani (2011). Regularization Paths for Cox's Proportional Hazards Model via Coordinate Descent. Journal of Statistical Software, 39(5), 1-13. URL http://www.jstatsoft.org/v39/i05/.
Ulla B. Mogensen, Hemant Ishwaran, Thomas A. Gerds (2012). Evaluating Random Forests for Survival Analysis Using Prediction Error Curves. Journal of Statistical Software, 50(11), 1-23. URL http://www.jstatsoft.org/v50/i11/.
Max Kuhn and Hadley Wickham (2017). rsample: General Resampling Infrastructure. R package version 0.0.2. https://CRAN.R-project.org/package=rsample
Liang Li, Cai Wu Department of Biostatistics and The University of Texas MD Anderson Cancer Center (2016). tdROC: Nonparametric Estimation of Time-Dependent ROC Curve from Right Censored Survival Data. R package version 1.0. https://CRAN.R-project.org/package=tdROC
Guangchuang Yu, Li-Gen Wang, Yanyan Han and Qing-Yu He. clusterProfiler: an R package for comparing biological themes among gene clusters. OMICS: A Journal of Integrative Biology 2012, 16(5):284-287
McLachlan, G. Discriminant analysis and statistical pattern recognition. 544, (John Wiley & Sons, 2004).
R Package Documentation
Browse R Packages
We want your feedback!
Note that we can't provide technical support on individual packages. You should contact the package authors for that.
Embedding an R snippet on your website
Add the following code to your website.
For more information on customizing the embed code, read Embedding Snippets.