README.md
In datagistips/geosparklines: Create Geographic Sparklines
geosparklines
geosparklines is an R package that you can use to create SparkLines as SimpleFeatureCollection (sfc) objects which can be further put on a map
Quick Start
Installation
devtools::install_github("datagistips/geosparklines", build_vignettes = TRUE)
Usage
Crteate geosparklines from a data frame
library(geosparklines)
library(readr)
library(sf)

f <- read_csv("https://raw.githubusercontent.com/CSSEGISandData/COVID-19/master/csse_covid_19_data/csse_covid_19_time_series/time_series_covid19_confirmed_global.csv") # it's John Hopkins Institute Data

geosparks <- geospark(coords = f[, c("Long", "Lat")], my_stats = f[, 5:ncol(f)], width = 20, height = 20, mode = "log") # log transformed sparklines as an sfc (Simple Feature Collection)

st_geometry(f) <- geosparks
Or individual geosparklines, for which you can control the width, height, direction based on data
sp_line <- singleGeospark(my_coords, v, width=20, height=20, direction="ne", mode="log")
There is also a method for generating sparklines inspired by FT Dataviz designer John Burn-Murdoch.
sp_line <- geosparkBM(my_coords, my_values, width=3, height=4, n = 21, direction = "ne"))
Here are for example four geosparklines with varying widths, heights, and directions illustrating the evolution of covid-19 cases in France

Vignettes
- Meet geosparklines with a reproducible example
- See how to reproject your data to an Equal Area projection like Plate Carrée
- Put John Burn Murdoch's smoothed Sparklines on a map
Rendering
You can render data in R, for instance with ggplot or leaflet
Also, you can export data :
st_write(f, "data/my_geosparlines.gpkg) ## f is the sf object generated above
Then render it in QGIS
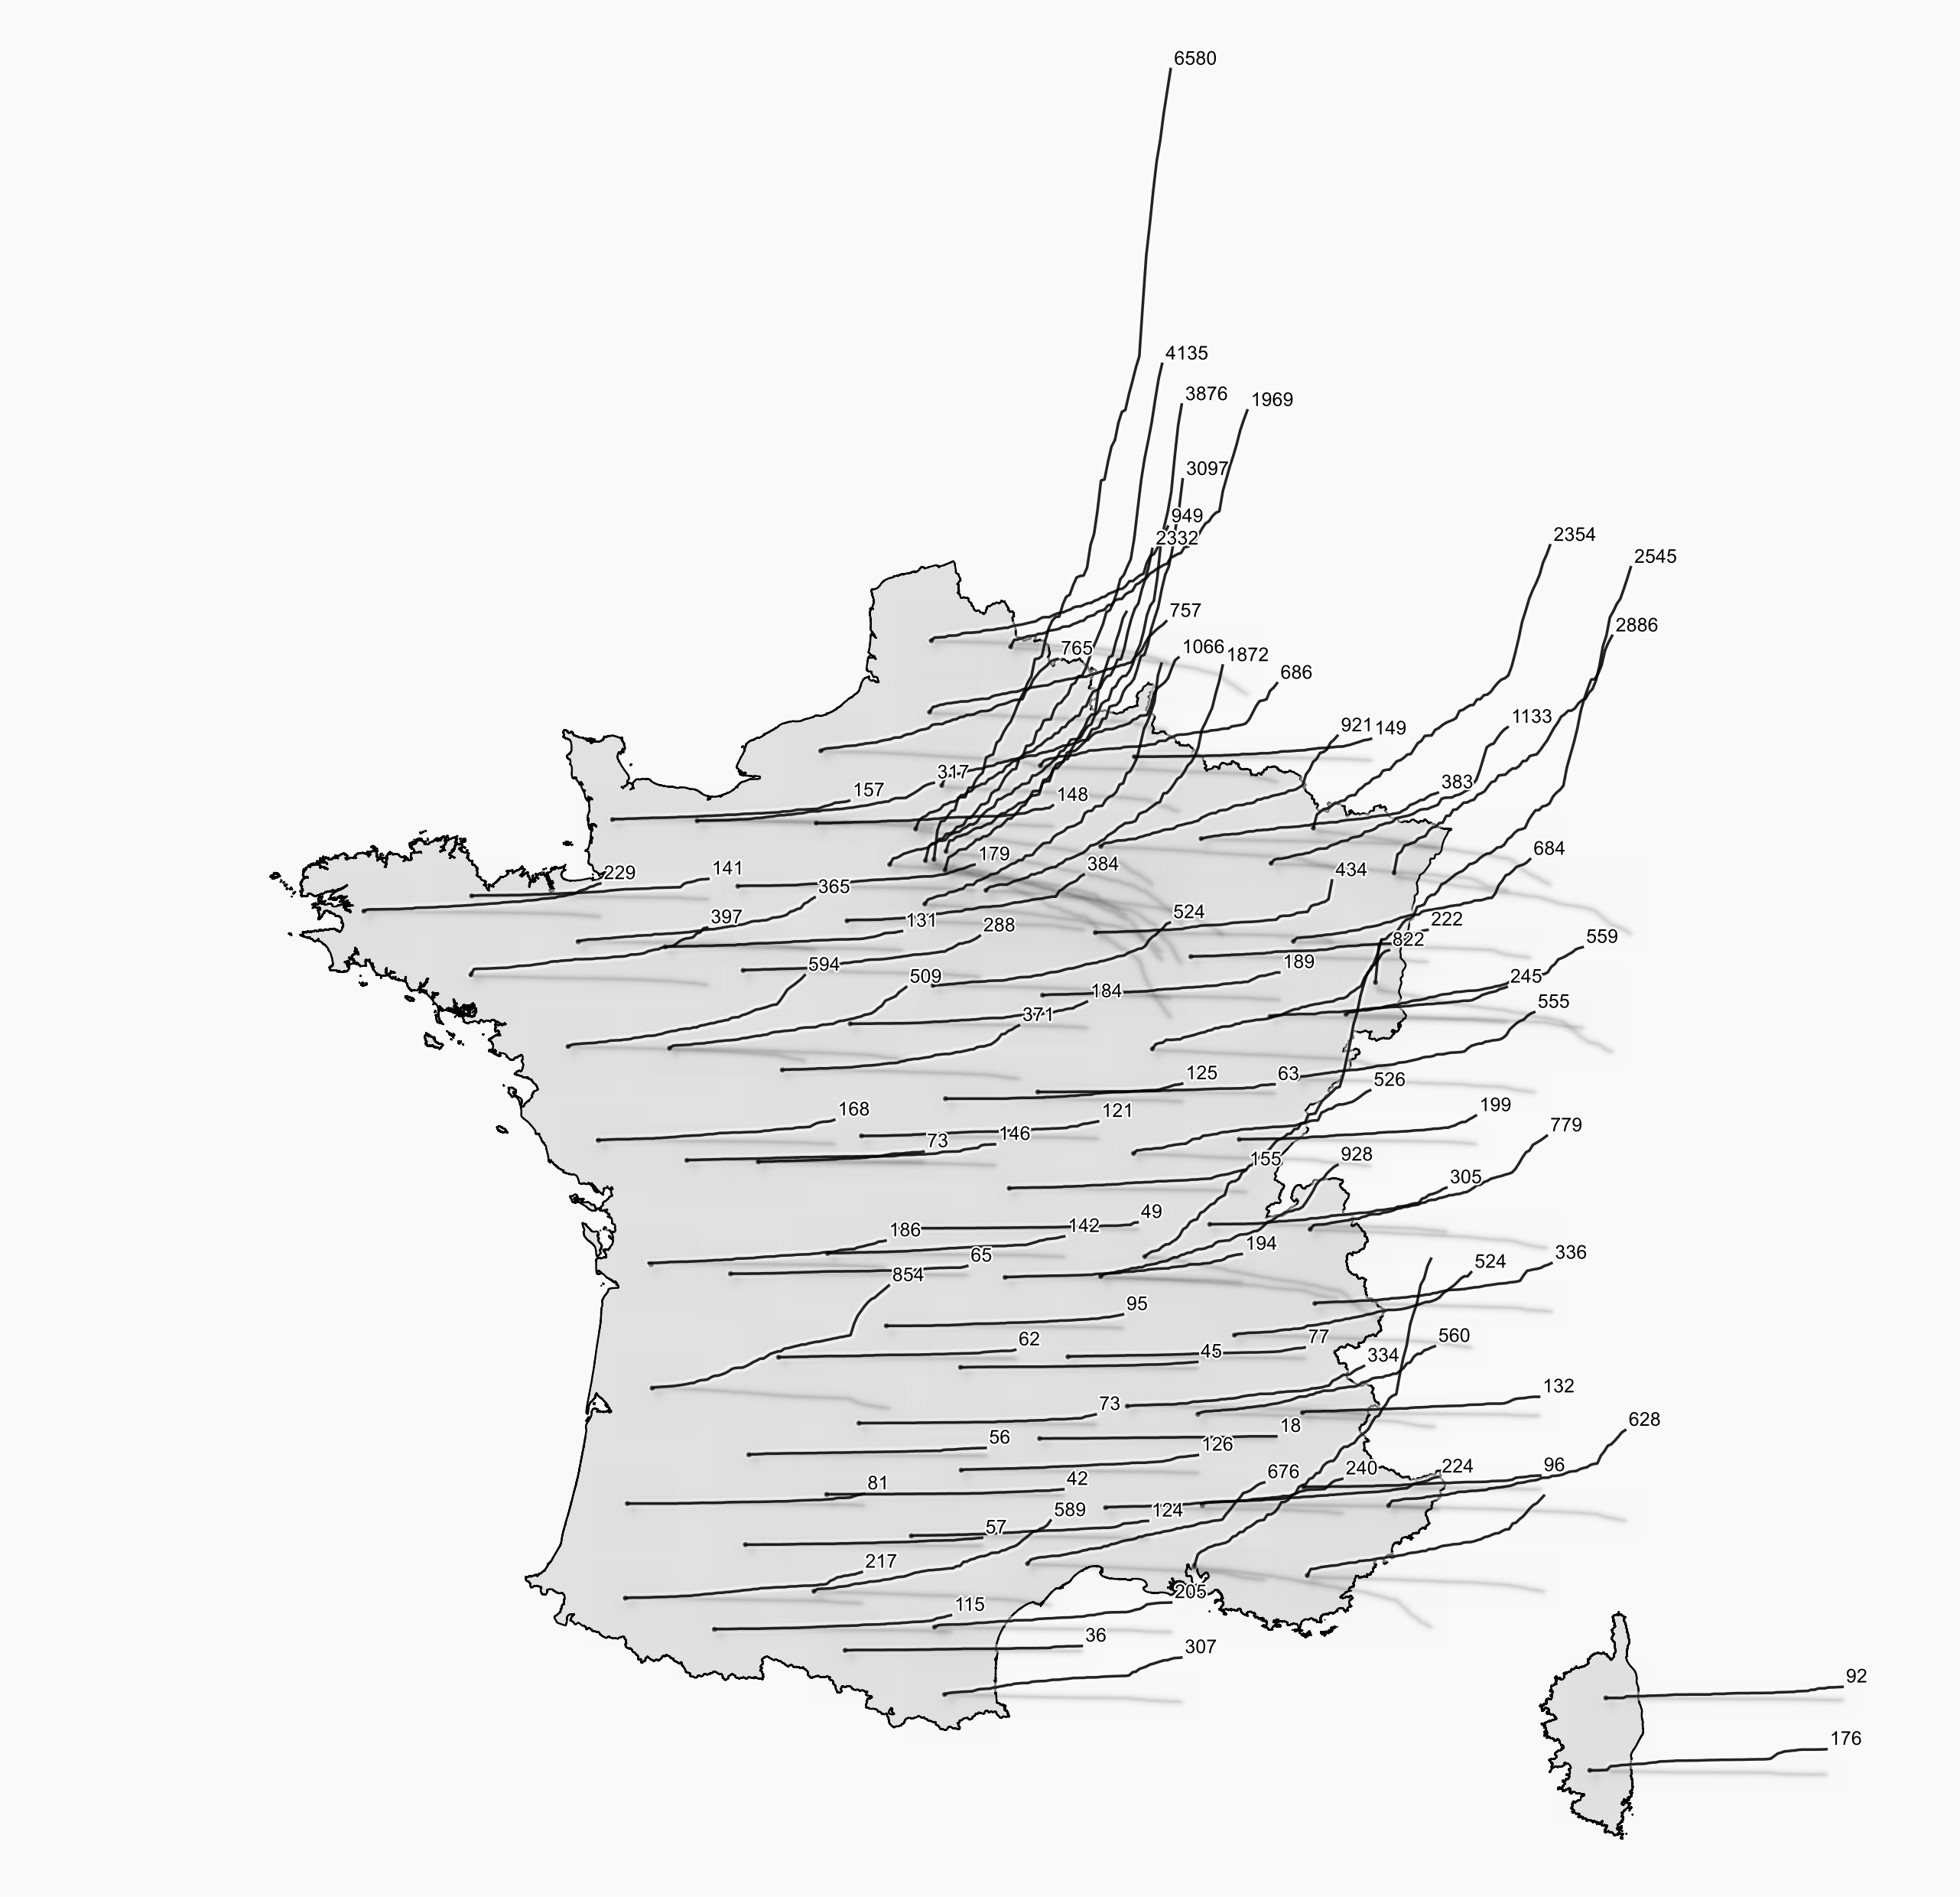
Here is a map of covid cases in France, rendered in QGIS :
License
License : GPL-3
Author : Mathieu Rajerison
datagistips/geosparklines documentation built on April 28, 2020, 3:03 p.m.
R Package Documentation
Browse R Packages
We want your feedback!
Note that we can't provide technical support on individual packages. You should contact the package authors for that.
geosparklines
geosparklines is an R package that you can use to create SparkLines as SimpleFeatureCollection (sfc) objects which can be further put on a map
Quick Start
Installation
devtools::install_github("datagistips/geosparklines", build_vignettes = TRUE)
Usage
Crteate geosparklines from a data frame
library(geosparklines)
library(readr)
library(sf)
f <- read_csv("https://raw.githubusercontent.com/CSSEGISandData/COVID-19/master/csse_covid_19_data/csse_covid_19_time_series/time_series_covid19_confirmed_global.csv") # it's John Hopkins Institute Data
geosparks <- geospark(coords = f[, c("Long", "Lat")], my_stats = f[, 5:ncol(f)], width = 20, height = 20, mode = "log") # log transformed sparklines as an sfc (Simple Feature Collection)
st_geometry(f) <- geosparks
Or individual geosparklines, for which you can control the width, height, direction based on data
sp_line <- singleGeospark(my_coords, v, width=20, height=20, direction="ne", mode="log")
There is also a method for generating sparklines inspired by FT Dataviz designer John Burn-Murdoch.
sp_line <- geosparkBM(my_coords, my_values, width=3, height=4, n = 21, direction = "ne"))
Here are for example four geosparklines with varying widths, heights, and directions illustrating the evolution of covid-19 cases in France
Vignettes
- Meet geosparklines with a reproducible example
- See how to reproject your data to an Equal Area projection like Plate Carrée
- Put John Burn Murdoch's smoothed Sparklines on a map
Rendering
You can render data in R, for instance with ggplot or leaflet
Also, you can export data :
st_write(f, "data/my_geosparlines.gpkg) ## f is the sf object generated above
Then render it in QGIS
Here is a map of covid cases in France, rendered in QGIS :
License
License : GPL-3 Author : Mathieu Rajerison
R Package Documentation
Browse R Packages
We want your feedback!
Note that we can't provide technical support on individual packages. You should contact the package authors for that.
Embedding an R snippet on your website
Add the following code to your website.
For more information on customizing the embed code, read Embedding Snippets.