README.md
In dataspekt/croaq: Air quality in Croatia
This package simplifies access to air quality data in
Croatia from state and local networks of
measurement stations provided by Croatian Ministry of Environmental
Protection and Energy.
To use this package, install and load it:
#devtools::install_github("dataspekt/croaq")
library(croaq)
Main function of this package which is used to fetch data is croaq(),
but first you will probably want to view meta-data on stations,
pollutants and data types and take note of relevant codes and labels.
Use listStations() for stations, listPollutants() for pollutants and
listDatatypes() for data types, for example:
head(listPollutants())

##   code label                                 fullname
## 1    1   no2            NO₂ - dušikov dioksid (µg/m3)
## 2    2   so2           SO₂ - sumporov dioksid (µg/m3)
## 3    3    co           CO - ugljikov monoksid (mg/m3)
## 4    4   h2s               H₂S - sumporovodik (µg/m3)
## 5    5  pm10   PM₁₀ - lebdeće čestice (<10µm) (µg/m3)
## 6   28 pm2.5 PM₂.₅ - lebdeće čestice (<2.5µm) (µg/m3)
Use the following call to access data on levels of carbon monoxide
(co), nitrogen dioxide (no2), sulfur dioxide (so2) and coarse
particulate matter (pm10) measured at station ZAGREB-1 (code 155) as
raw, unvalidated hourly values (type = 0) during first 15 days of
December 2017:
data <- croaq(155, c("co","no2","so2","pm10"), from = "2017-12-01", to = "2017-12-15", type = 0)
Result of this function call is an object of class croaq which
inherits from a data frame and offers custom summary() and plot()
methods.
head(data)

##     station code label  unit type                time value
## 1.1     155    1   no2 µg/m3    0 2017-12-01 01:00:00  30.0
## 1.2     155    1   no2 µg/m3    0 2017-12-01 02:00:00  19.8
## 1.3     155    1   no2 µg/m3    0 2017-12-01 03:00:00  17.6
## 1.4     155    1   no2 µg/m3    0 2017-12-01 04:00:00  16.6
## 1.5     155    1   no2 µg/m3    0 2017-12-01 05:00:00  20.1
## 1.6     155    1   no2 µg/m3    0 2017-12-01 06:00:00  31.5

summary(data)

## Station: 155
## Items: no2, so2, co, pm10
## From: 2017-12-01 01:00:00 CET
## To: 2017-12-16 00:00:00 CET
## Values:
##      total missing
## co     360      38
## no2    360      38
## so2    360      38
## pm10   360      28
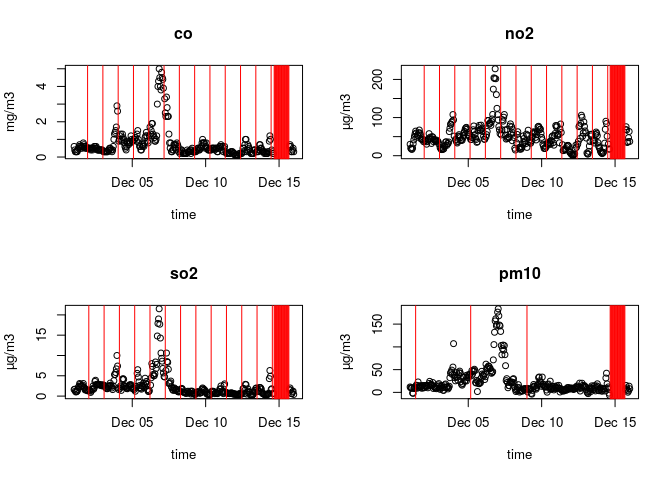
Plotting this object will show time on x-axis and item values on y-axis.
Time points with missing data are shown as vertical red lines.
plot(data)
Sometimes it is handy to work with data in wide instead of long format.
Function wide() will reshape resulting object into a wide data frame:
head(wide(data))

##     station type                time code.no2 unit.no2 value.no2 code.so2
## 1.1     155    0 2017-12-01 01:00:00        1    µg/m3      30.0        2
## 1.2     155    0 2017-12-01 02:00:00        1    µg/m3      19.8        2
## 1.3     155    0 2017-12-01 03:00:00        1    µg/m3      17.6        2
## 1.4     155    0 2017-12-01 04:00:00        1    µg/m3      16.6        2
## 1.5     155    0 2017-12-01 05:00:00        1    µg/m3      20.1        2
## 1.6     155    0 2017-12-01 06:00:00        1    µg/m3      31.5        2
##     unit.so2 value.so2 code.co unit.co value.co code.pm10 unit.pm10
## 1.1    µg/m3       1.6       3   mg/m3      0.6         5     µg/m3
## 1.2    µg/m3       1.7       3   mg/m3      0.4         5     µg/m3
## 1.3    µg/m3       1.2       3   mg/m3      0.3         5     µg/m3
## 1.4    µg/m3       1.0       3   mg/m3      0.3         5     µg/m3
## 1.5    µg/m3       1.1       3   mg/m3      0.3         5     µg/m3
## 1.6    µg/m3       1.2       3   mg/m3      0.3         5     µg/m3
##     value.pm10
## 1.1       11.9
## 1.2       10.0
## 1.3        9.9
## 1.4        9.2
## 1.5       -1.4
## 1.6       -2.2
Please note that availabilty of data depends on selected station,
pollutants and data type. If no requested data is available, function
croaq() will return NULL. It is recommended to check beforehand if
data is available using UI at http://iszz.azo.hr/iskzl/exc.htm.
dataspekt/croaq documentation built on May 19, 2019, 12:36 a.m.
R Package Documentation
Browse R Packages
We want your feedback!
Note that we can't provide technical support on individual packages. You should contact the package authors for that.
This package simplifies access to air quality data in Croatia from state and local networks of measurement stations provided by Croatian Ministry of Environmental Protection and Energy.
To use this package, install and load it:
#devtools::install_github("dataspekt/croaq")
library(croaq)
Main function of this package which is used to fetch data is croaq(),
but first you will probably want to view meta-data on stations,
pollutants and data types and take note of relevant codes and labels.
Use listStations() for stations, listPollutants() for pollutants and
listDatatypes() for data types, for example:
head(listPollutants())
## code label fullname
## 1 1 no2 NO₂ - dušikov dioksid (µg/m3)
## 2 2 so2 SO₂ - sumporov dioksid (µg/m3)
## 3 3 co CO - ugljikov monoksid (mg/m3)
## 4 4 h2s H₂S - sumporovodik (µg/m3)
## 5 5 pm10 PM₁₀ - lebdeće čestice (<10µm) (µg/m3)
## 6 28 pm2.5 PM₂.₅ - lebdeće čestice (<2.5µm) (µg/m3)
Use the following call to access data on levels of carbon monoxide
(co), nitrogen dioxide (no2), sulfur dioxide (so2) and coarse
particulate matter (pm10) measured at station ZAGREB-1 (code 155) as
raw, unvalidated hourly values (type = 0) during first 15 days of
December 2017:
data <- croaq(155, c("co","no2","so2","pm10"), from = "2017-12-01", to = "2017-12-15", type = 0)
Result of this function call is an object of class croaq which
inherits from a data frame and offers custom summary() and plot()
methods.
head(data)
## station code label unit type time value
## 1.1 155 1 no2 µg/m3 0 2017-12-01 01:00:00 30.0
## 1.2 155 1 no2 µg/m3 0 2017-12-01 02:00:00 19.8
## 1.3 155 1 no2 µg/m3 0 2017-12-01 03:00:00 17.6
## 1.4 155 1 no2 µg/m3 0 2017-12-01 04:00:00 16.6
## 1.5 155 1 no2 µg/m3 0 2017-12-01 05:00:00 20.1
## 1.6 155 1 no2 µg/m3 0 2017-12-01 06:00:00 31.5
summary(data)
## Station: 155
## Items: no2, so2, co, pm10
## From: 2017-12-01 01:00:00 CET
## To: 2017-12-16 00:00:00 CET
## Values:
## total missing
## co 360 38
## no2 360 38
## so2 360 38
## pm10 360 28
Plotting this object will show time on x-axis and item values on y-axis. Time points with missing data are shown as vertical red lines.
plot(data)
Sometimes it is handy to work with data in wide instead of long format.
Function wide() will reshape resulting object into a wide data frame:
head(wide(data))
## station type time code.no2 unit.no2 value.no2 code.so2
## 1.1 155 0 2017-12-01 01:00:00 1 µg/m3 30.0 2
## 1.2 155 0 2017-12-01 02:00:00 1 µg/m3 19.8 2
## 1.3 155 0 2017-12-01 03:00:00 1 µg/m3 17.6 2
## 1.4 155 0 2017-12-01 04:00:00 1 µg/m3 16.6 2
## 1.5 155 0 2017-12-01 05:00:00 1 µg/m3 20.1 2
## 1.6 155 0 2017-12-01 06:00:00 1 µg/m3 31.5 2
## unit.so2 value.so2 code.co unit.co value.co code.pm10 unit.pm10
## 1.1 µg/m3 1.6 3 mg/m3 0.6 5 µg/m3
## 1.2 µg/m3 1.7 3 mg/m3 0.4 5 µg/m3
## 1.3 µg/m3 1.2 3 mg/m3 0.3 5 µg/m3
## 1.4 µg/m3 1.0 3 mg/m3 0.3 5 µg/m3
## 1.5 µg/m3 1.1 3 mg/m3 0.3 5 µg/m3
## 1.6 µg/m3 1.2 3 mg/m3 0.3 5 µg/m3
## value.pm10
## 1.1 11.9
## 1.2 10.0
## 1.3 9.9
## 1.4 9.2
## 1.5 -1.4
## 1.6 -2.2
Please note that availabilty of data depends on selected station,
pollutants and data type. If no requested data is available, function
croaq() will return NULL. It is recommended to check beforehand if
data is available using UI at http://iszz.azo.hr/iskzl/exc.htm.
R Package Documentation
Browse R Packages
We want your feedback!
Note that we can't provide technical support on individual packages. You should contact the package authors for that.
Embedding an R snippet on your website
Add the following code to your website.
For more information on customizing the embed code, read Embedding Snippets.