README.md
In disarm-platform/MapPalettes:
MapPalettes
A set of nifty palettes and functions for maps designed by the DiSARM team at UCSF
Install
library(devtools)
install_github("disarm-platform/MapPalettes")
library(MapPalettes)
Palettes
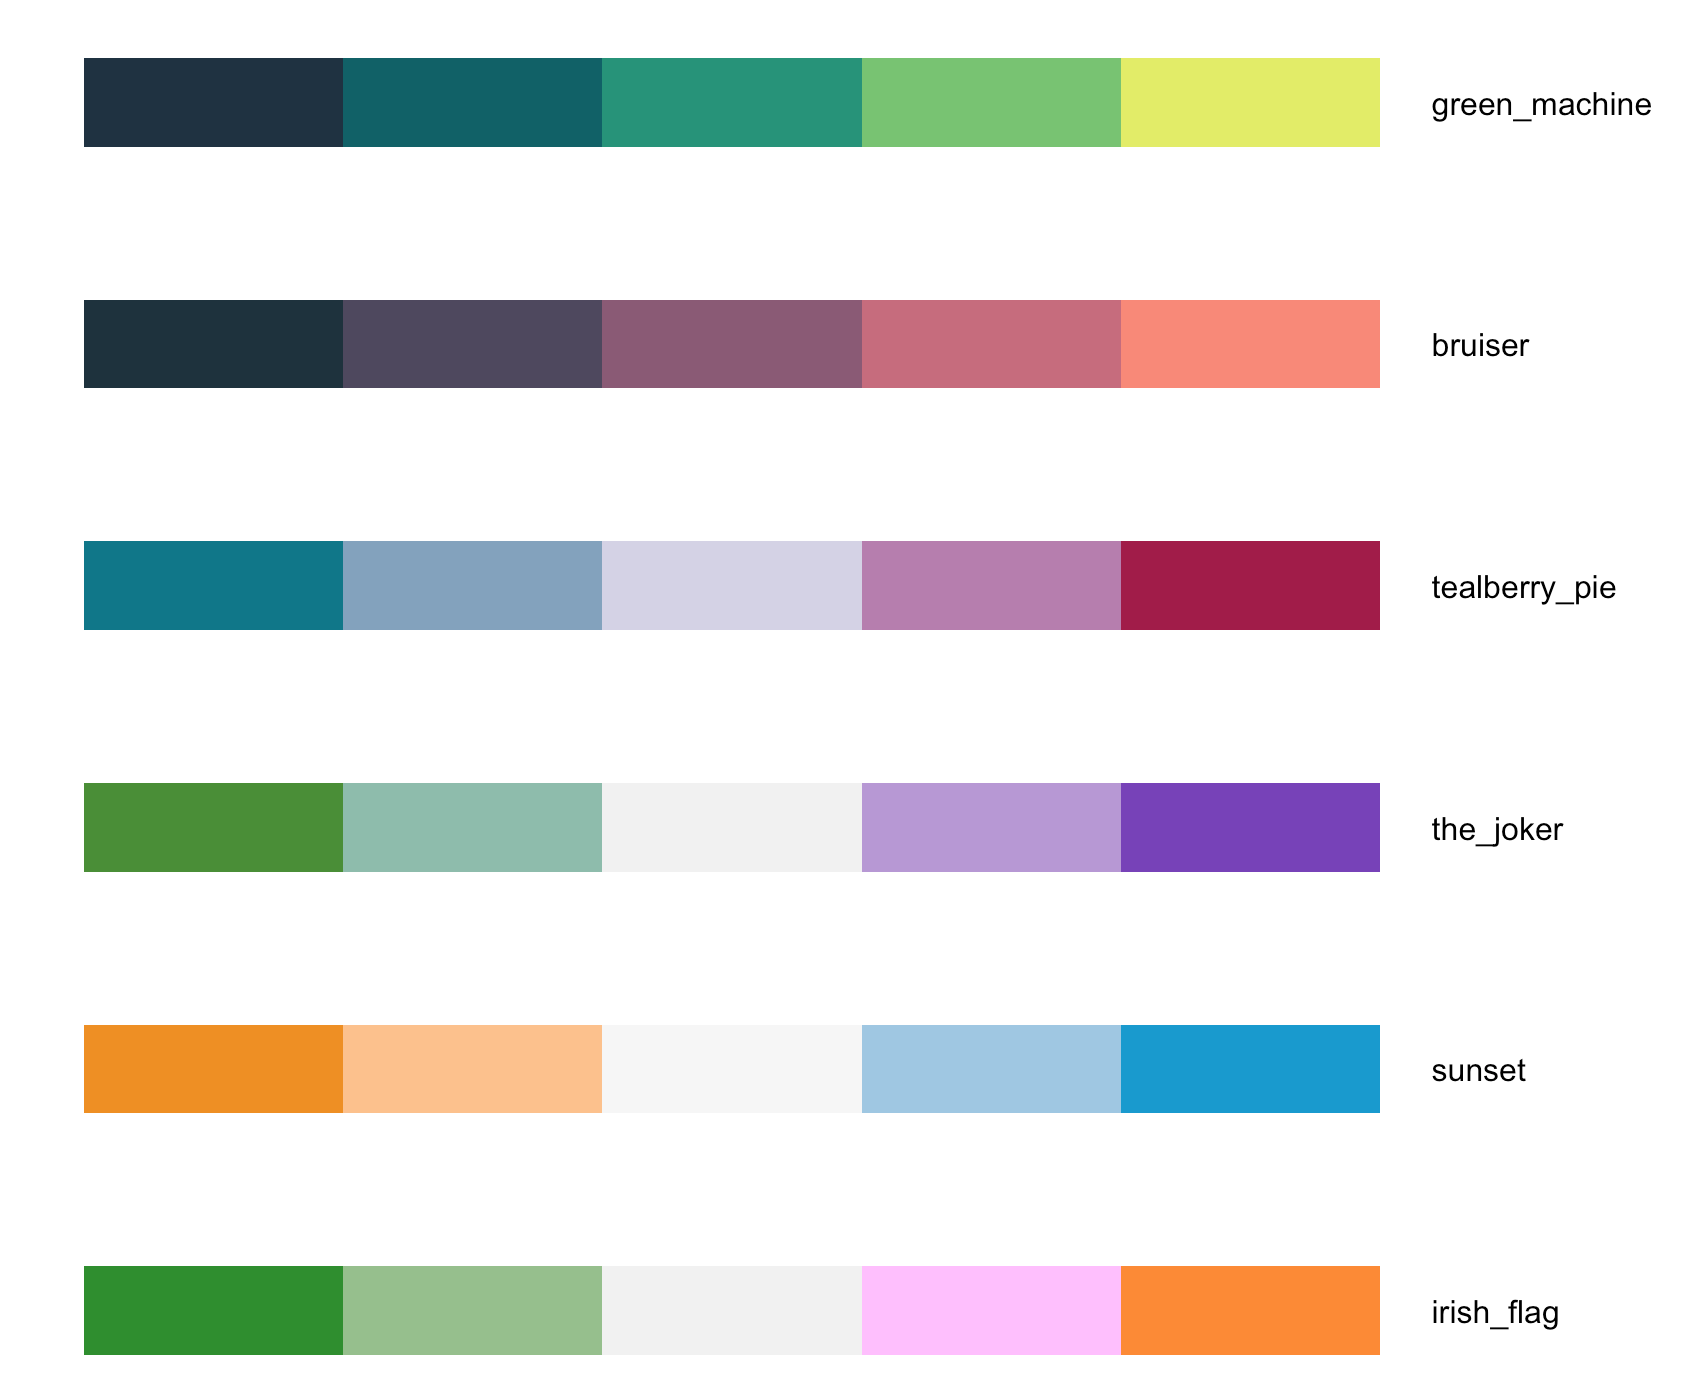
Examples
view_palette("green_machine", n=64, type = "raster")

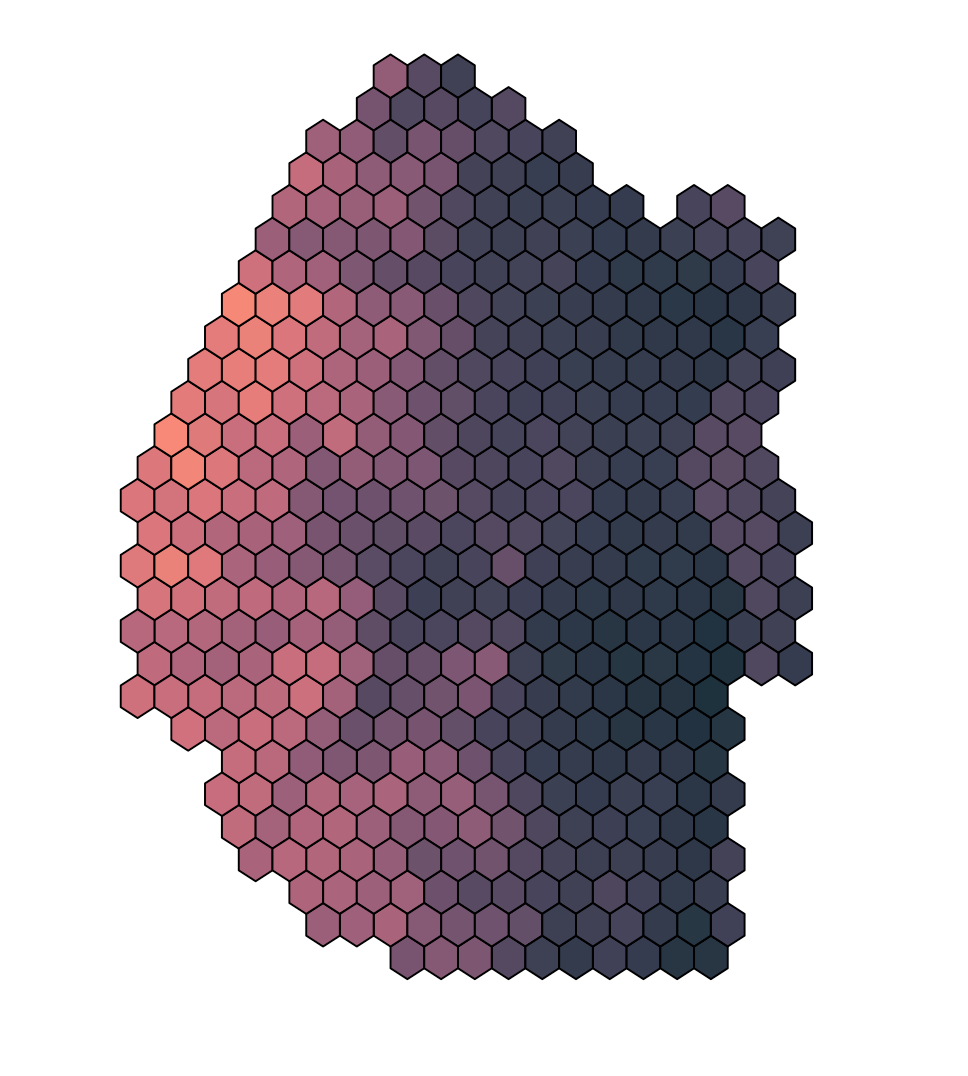
To create a hex bin plot from a raster
library(leaflet) # for colorNumeric function
data("swz_elev")
hexbins <- hexbin_raster(swz_elev, n=300, function(x) mean(x, na.rm = TRUE))
col_pal <- colorNumeric(map_palette("bruiser", n=10), hexbins$stat)
plot(hexbins, col = col_pal(hexbins$stat))
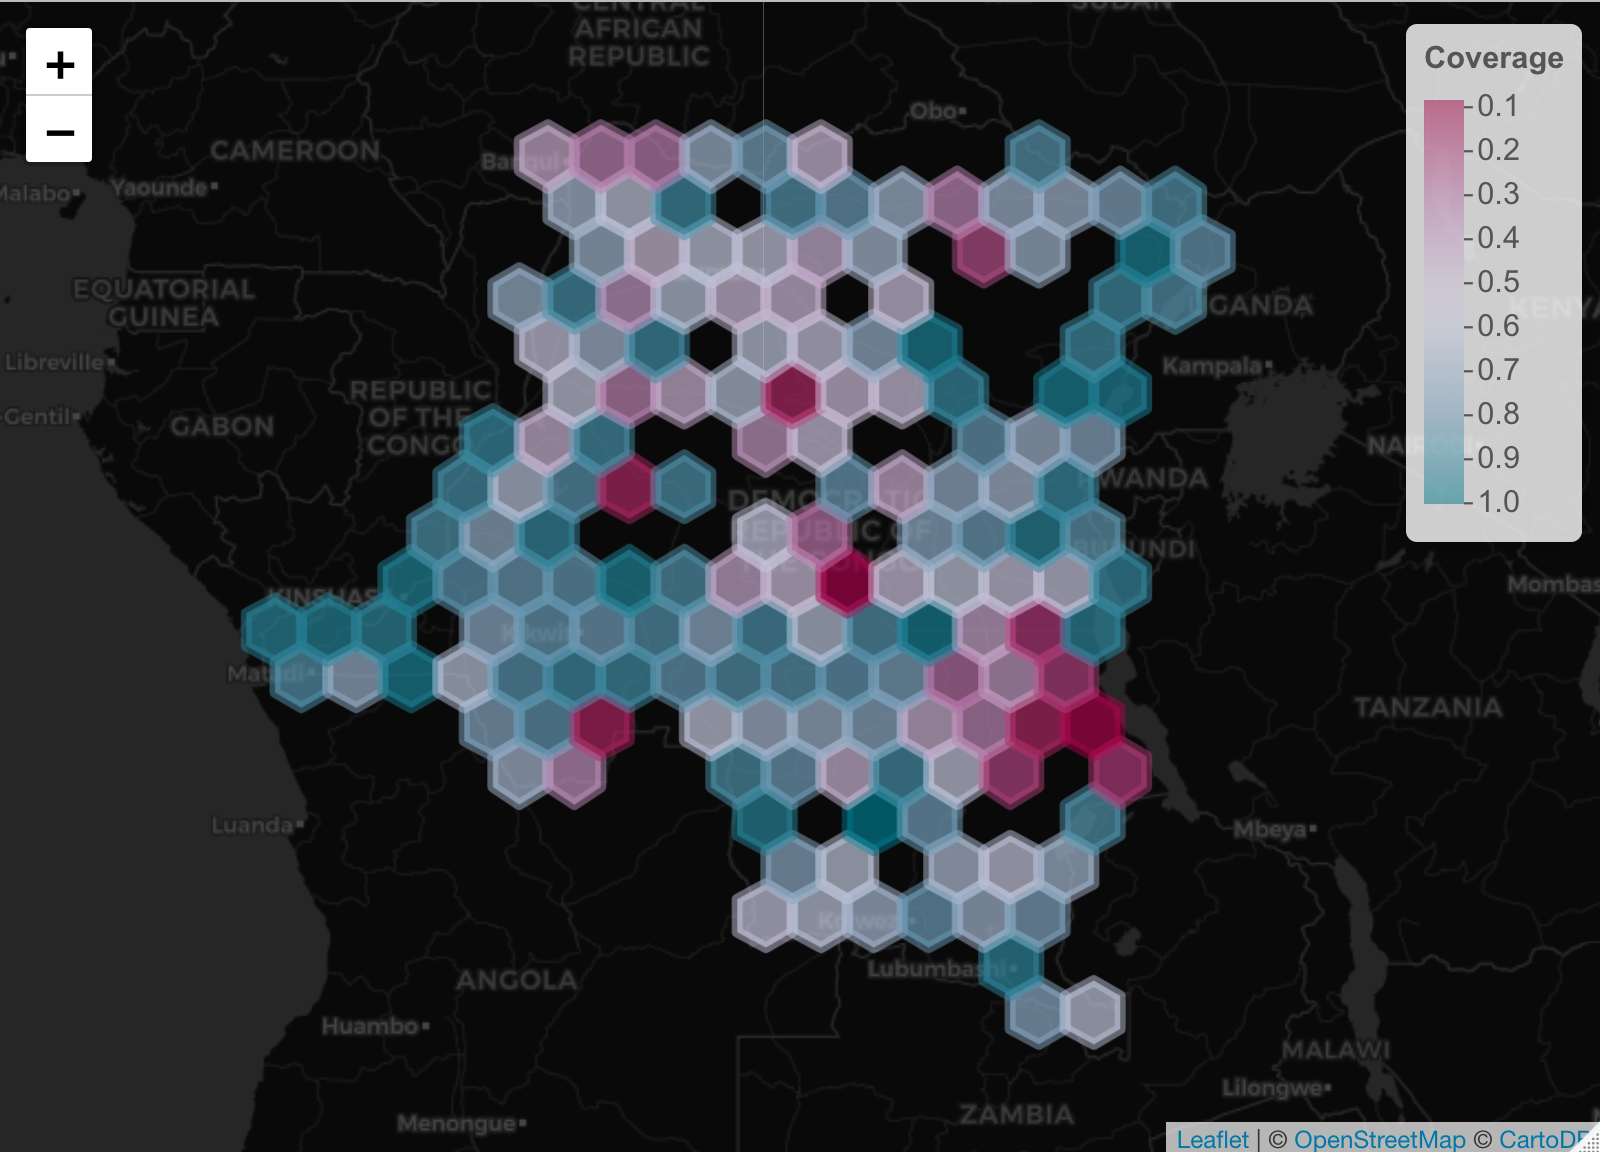
To create a hex bin plot from points and plot using leaflet
This example uses the supplied Demographic and Health Survey data on BCG vaccination
in the DRC
library(leaflet)

# Load data
data("BCG_vaccination_DRC")

# Generate hexbins
hexbins <- hexbin_points(BCG_vaccination_DRC, n = 400, fun = mean, z = "coverage")

# Generate color palette
col_pal <- colorNumeric(rev(map_palette("tealberry_pie", n=10)), hexbins$stat)

# Plot
leaflet() %>% addProviderTiles("CartoDB.DarkMatter") %>%
          addPolygons(data = hexbins, col = col_pal(hexbins$coverage),
          fillOpacity = 0.7) %>%
          addLegend(pal = col_pal, values = hexbins$coverage,
          title = "Coverage")
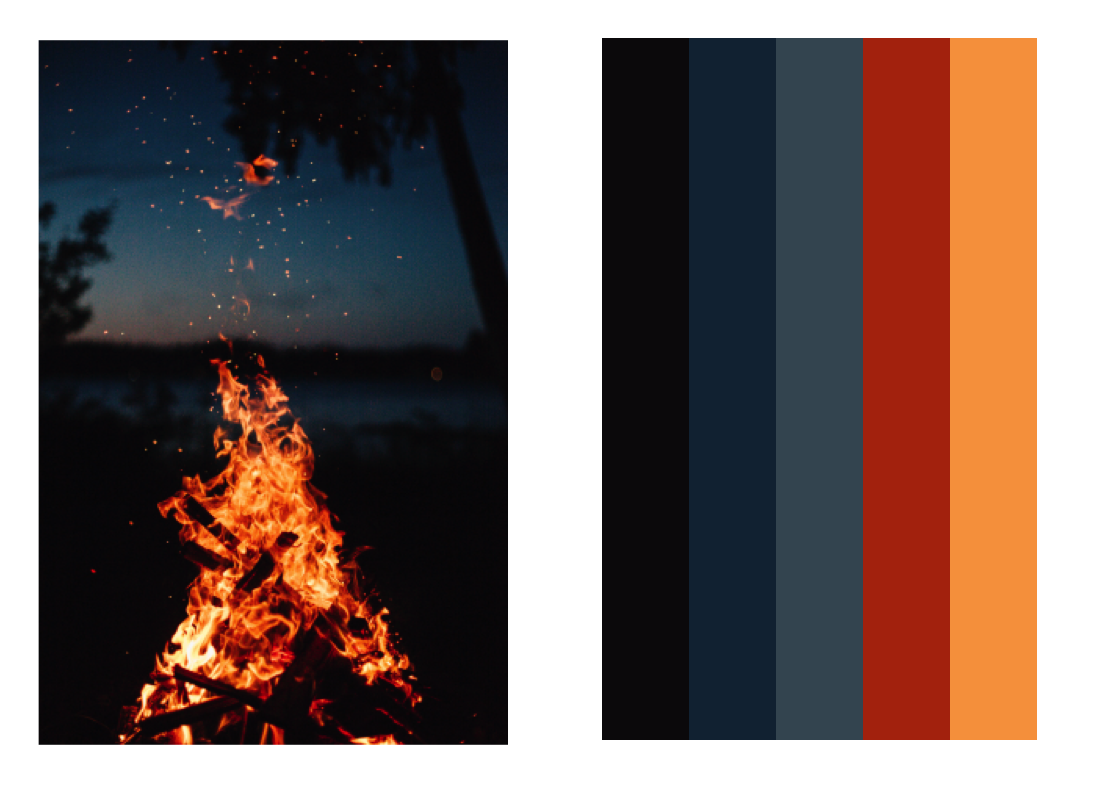
To get main color groups from an image (Photo by Nathan Lindahl on Unsplash.com)
get_colors_from_image("https://raw.githubusercontent.com/HughSt/mappalettes/master/images/nathan-lindahl-1j18807_ul0-unsplash.jpg",5)
[1] "#0C080B" "#142D40" "#425662" "#B3330C" "#F8A14B"
disarm-platform/MapPalettes documentation built on Jan. 11, 2020, 5:51 p.m.
R Package Documentation
Browse R Packages
We want your feedback!
Note that we can't provide technical support on individual packages. You should contact the package authors for that.
MapPalettes
A set of nifty palettes and functions for maps designed by the DiSARM team at UCSF
Install
library(devtools)
install_github("disarm-platform/MapPalettes")
library(MapPalettes)
Palettes
Examples
view_palette("green_machine", n=64, type = "raster")
To create a hex bin plot from a raster
library(leaflet) # for colorNumeric function
data("swz_elev")
hexbins <- hexbin_raster(swz_elev, n=300, function(x) mean(x, na.rm = TRUE))
col_pal <- colorNumeric(map_palette("bruiser", n=10), hexbins$stat)
plot(hexbins, col = col_pal(hexbins$stat))
To create a hex bin plot from points and plot using leaflet
This example uses the supplied Demographic and Health Survey data on BCG vaccination in the DRC
library(leaflet)
# Load data
data("BCG_vaccination_DRC")
# Generate hexbins
hexbins <- hexbin_points(BCG_vaccination_DRC, n = 400, fun = mean, z = "coverage")
# Generate color palette
col_pal <- colorNumeric(rev(map_palette("tealberry_pie", n=10)), hexbins$stat)
# Plot
leaflet() %>% addProviderTiles("CartoDB.DarkMatter") %>%
addPolygons(data = hexbins, col = col_pal(hexbins$coverage),
fillOpacity = 0.7) %>%
addLegend(pal = col_pal, values = hexbins$coverage,
title = "Coverage")
To get main color groups from an image (Photo by Nathan Lindahl on Unsplash.com)
get_colors_from_image("https://raw.githubusercontent.com/HughSt/mappalettes/master/images/nathan-lindahl-1j18807_ul0-unsplash.jpg",5)
[1] "#0C080B" "#142D40" "#425662" "#B3330C" "#F8A14B"
R Package Documentation
Browse R Packages
We want your feedback!
Note that we can't provide technical support on individual packages. You should contact the package authors for that.
Embedding an R snippet on your website
Add the following code to your website.
For more information on customizing the embed code, read Embedding Snippets.