In dynverse/dynwrap: Representing and Inferring Single-Cell Trajectories
library(dplyr)
library(tibble)
library(dynwrap)
Common trajectory model
dynwrap always represents trajectories in the same way, as illustrated here with a tree trajectory
- Milestone network, contains information of connections between milestones
milestone_network <- tribble(
  ~from, ~to, ~length, ~directed,
  "A", "B", 1, FALSE,
  "B", "C", 2, FALSE,
  "B", "D", 1, FALSE,
  "C", "E", 1, FALSE,
  "C", "F", 1.5, FALSE
)
milestone_network$from <- paste0("Milestone_", milestone_network$from)
milestone_network$to <- paste0("Milestone_", milestone_network$to)
milestone_ids <- paste0("Milestone_", c("A", "B", "C", "D", "E", "F"))
milestone_network
- Milestone percentages, contains how close a cell is to a milestone. For each cell, the percentages sum to one.
cell_ids <- paste0("Cell_", letters)
progressions <- milestone_network %>%
  sample_n(length(cell_ids), replace = TRUE, weight = length) %>%
  mutate(
    cell_id = cell_ids,
    percentage = runif(n())
  ) %>%
  select(cell_id, from, to, percentage)
milestone_percentages <- dynwrap::convert_progressions_to_milestone_percentages(cell_ids, milestone_ids, milestone_network, progressions) %>% arrange(cell_id, milestone_id)
head(milestone_percentages, 10)
- Progressions, an alternative to milestone percentages, also contains the positions of each cell but now based on its progression through an edge
head(progressions, 10)
- Divergence regions, contain the information on >=3 milestones connected to eachother. This is optional.
divergence_regions <- tribble(
  ~divergence_id, ~milestone_id, ~is_start,
  "Divergence_1", "Milestone_B", TRUE,
  "Divergence_1", "Milestone_C", FALSE,
  "Divergence_1", "Milestone_D", FALSE
)
head(divergence_regions)
Direct wrapping
These three objects (with either milestone percentages or progressions) are enough to form a trajectory using add_trajectory.
trajectory <- wrap_data(cell_ids = cell_ids) %>%
  add_trajectory(
    milestone_network = milestone_network,
    milestone_percentages = milestone_percentages,
    divergence_regions = divergence_regions
  )
Indirect wrapping
Often, you don't want to directly output the milestone network and percentages, but want to output an alternative representation that is converted by dynwrap to the common representation:
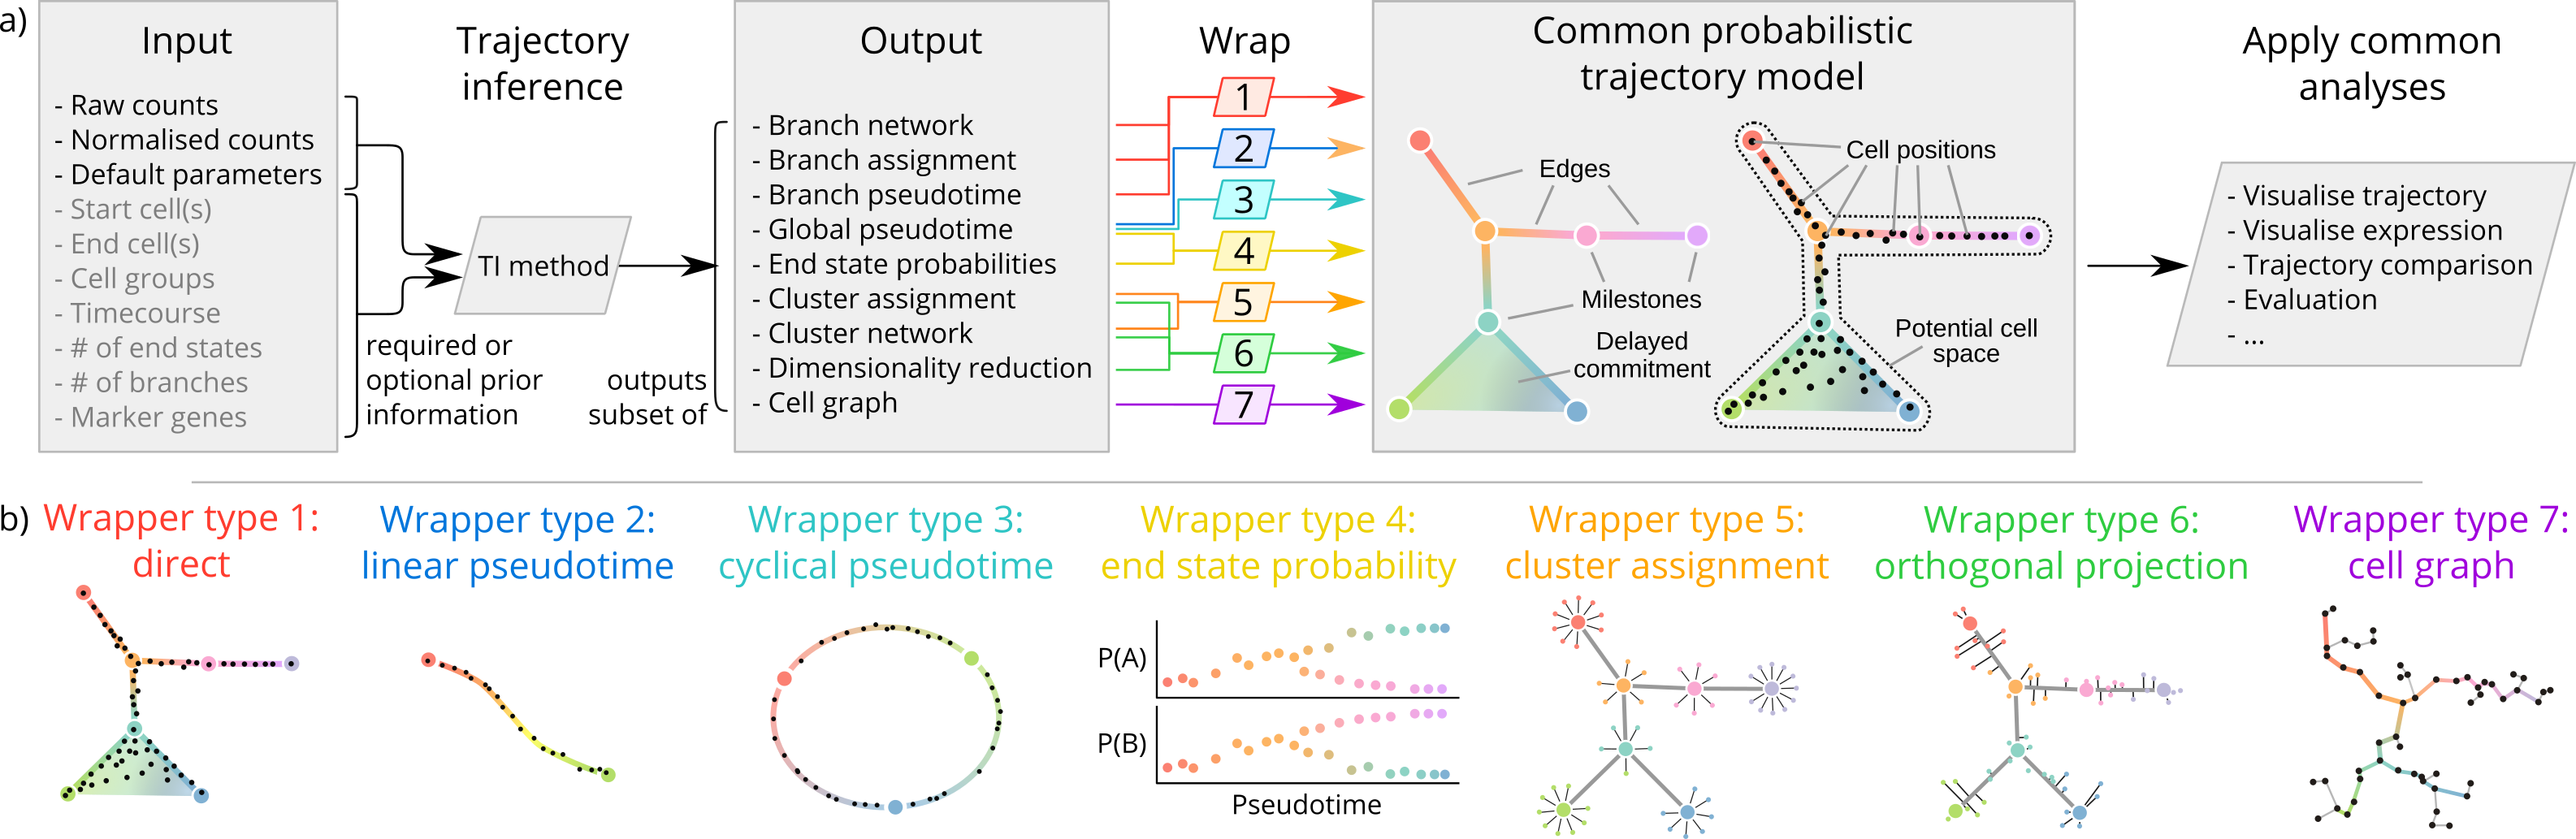
Check out the reference documentation for an overview and examples of the different wrappers
dynverse/dynwrap documentation built on July 30, 2023, 3:34 p.m.
R Package Documentation
Browse R Packages
We want your feedback!
Note that we can't provide technical support on individual packages. You should contact the package authors for that.
library(dplyr) library(tibble) library(dynwrap)
Common trajectory model
dynwrap always represents trajectories in the same way, as illustrated here with a tree trajectory
- Milestone network, contains information of connections between milestones
milestone_network <- tribble( ~from, ~to, ~length, ~directed, "A", "B", 1, FALSE, "B", "C", 2, FALSE, "B", "D", 1, FALSE, "C", "E", 1, FALSE, "C", "F", 1.5, FALSE ) milestone_network$from <- paste0("Milestone_", milestone_network$from) milestone_network$to <- paste0("Milestone_", milestone_network$to) milestone_ids <- paste0("Milestone_", c("A", "B", "C", "D", "E", "F")) milestone_network
- Milestone percentages, contains how close a cell is to a milestone. For each cell, the percentages sum to one.
cell_ids <- paste0("Cell_", letters) progressions <- milestone_network %>% sample_n(length(cell_ids), replace = TRUE, weight = length) %>% mutate( cell_id = cell_ids, percentage = runif(n()) ) %>% select(cell_id, from, to, percentage) milestone_percentages <- dynwrap::convert_progressions_to_milestone_percentages(cell_ids, milestone_ids, milestone_network, progressions) %>% arrange(cell_id, milestone_id) head(milestone_percentages, 10)
- Progressions, an alternative to milestone percentages, also contains the positions of each cell but now based on its progression through an edge
head(progressions, 10)
- Divergence regions, contain the information on >=3 milestones connected to eachother. This is optional.
divergence_regions <- tribble( ~divergence_id, ~milestone_id, ~is_start, "Divergence_1", "Milestone_B", TRUE, "Divergence_1", "Milestone_C", FALSE, "Divergence_1", "Milestone_D", FALSE ) head(divergence_regions)
Direct wrapping
These three objects (with either milestone percentages or progressions) are enough to form a trajectory using add_trajectory.
trajectory <- wrap_data(cell_ids = cell_ids) %>% add_trajectory( milestone_network = milestone_network, milestone_percentages = milestone_percentages, divergence_regions = divergence_regions )
Indirect wrapping
Often, you don't want to directly output the milestone network and percentages, but want to output an alternative representation that is converted by dynwrap to the common representation:
Check out the reference documentation for an overview and examples of the different wrappers
R Package Documentation
Browse R Packages
We want your feedback!
Note that we can't provide technical support on individual packages. You should contact the package authors for that.
Embedding an R snippet on your website
Add the following code to your website.
For more information on customizing the embed code, read Embedding Snippets.