README.md
In eevenden/SouthAfricaDrought: What the Package Does (One Line, Title Case)
SouthAfricaDrought
Authors: Emily Evenden and Maseeng Masitha
Date: December 22, 2020
Introduction
This page hosts the R-package "SouthAfricaDrought", our final project for the "Geospatial Analysis with R" course at Clark University.
We aim to identify areas of drought in South Africa over the summer season of November, 2019, to March, 2020. Drought is determined by persisting stretches of no rainfall. We will use two drought indices which rely solely on rainfall data: the Deciles Index and the NOAA Drought Index to identify areas of South Africa experiencing drought. Through this project, we hope to program easy drought metrics for South Africa which could be used to determine early warnings of low crop yields.
Primary Objectives
-
Make long-term and short-term rainfall data available to the user in both monthly and weekly time intervals
-
Program two drought indices
-
Identify areas in South Africa that experienced drought last Summer (2019-2020).
Approach and Method
Data
This package contains five datasets:
-
SouthAfrica_Boundary - a vector file containing the boundary of South Africa provided by the Humanitarian Data Exchange (available here: https://data.humdata.org/dataset/south-africa-admin-level-1-boundaries)
-
SA_MODIS_Monthly_Mean_Temperature - a raster stack of the average monthly temperature (in Celsius) for South Africa. This dataset is not currently used in any of the indices we created, but is available for future use if more indices are added.
-
& 4. SA_Chirps_Weekly_Mean_Precip & SA_Chirps_Monthly_Mean_Precip - these datasets are two different aggregations of the daily Chirps precipitation data. Obviously, the weekly data is aggregated by week while the monthly data is aggregated by month. The unit of this dataset is mm of rainfall per day.
-
SA_Chirps_30yr_Monthly_Mean_Precip - this datasets is also dervied from the Chirps daily precipitation dataset. Each raster layer in this dataset shows the 30 year average of rainfall for that month. The date range for this data is April 1, 1987 to March 31, 2018.
We obtained datasets for temperature and precipitation from Google Earth Engine (GEE) database. Specifically, we utilized the "Chirps Daily: Climate Hazards Group Infrared Precipitation" dataset (available here: https://developers.google.com/earth-engine/datasets/catalog/UCSB-CHG_CHIRPS_DAILY) and the "Terra Land Surface Temperature and Emissivity Daily Global 1km" dataset (available here: https://developers.google.com/earth-engine/datasets/catalog/MODIS_006_MOD11A1). These datasets were filtered by data and location and reduced using the mean function via the Javascript Code Editor available online through GEE. Once selected, the data was exported to Google Drive.
Finally data preprocessing was conducted using R. Following this, the datasets were clipped in R to the extent of the study area, South Africa. A function for calculating mean monthly amounts for the variables was applied on temperature and precipitation datasets and units converted where appropriate.
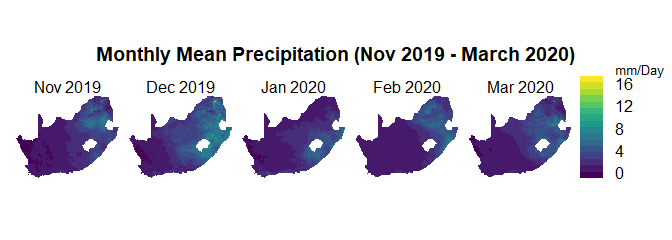
Here is an example of our raw data. The plot below shows monthly rainfall data for the months of November, 2019, to March, 2020.
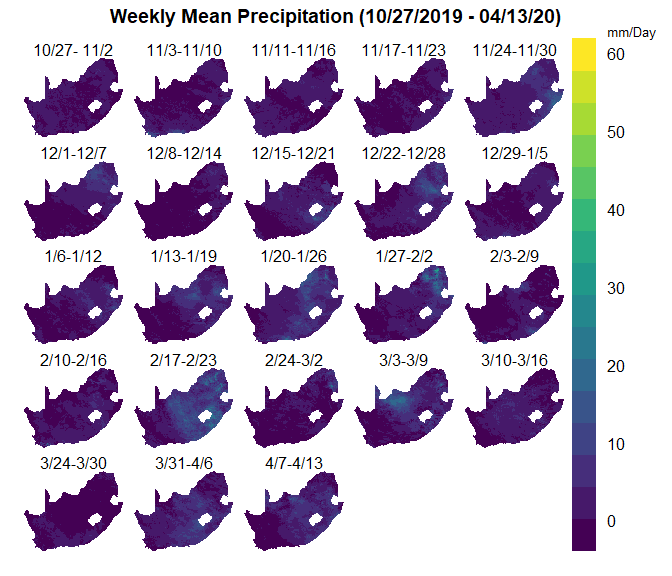
Here is another example of our raw data. This plot shows the weekly rainfall data.
Methods
We used the precipitation data to calculate two drought indices: the Deciles Index and the NOAA Drought Index.
1. Deciles Index
The Deciles Index compares precipitation from a specific time interval with precipitation from a historic time interval (usually 30 years or more). This index only uses precipitation data. The decile method divides each month of historic precipitation data into ten equal parts. These categories can then be used to assess the new time interval. The decile ranges can be categorized as such:
Deciles 1-2: Much below Normal
Deciles 3-4: Below Normal
Deciles 5-6: Near Normal
Deciles 7-8: Above Normal
Deciles 8-9: Much above Normal
Information source: https://agrimetsoft.com/faq/What%20is%20DI(Deciles%20Index)
2. NOAA Drought Index
The NOAA Drought Index is also a precipitation based index. This index utilizes weekly precipitation data for the time interval of interest. In this case, the mean precipitation for an eight-week interval is calculated and then compared with the subsequent ninth week. If the ninth week has more than 60% of the eight-week average, it's classified as having little to no water stress. An area is considered no longer stressed once the rainfall returns to 60% or more.
Information source: https://www.droughtmanagement.info/noaa-drought-index-ndi/
Data Visualization
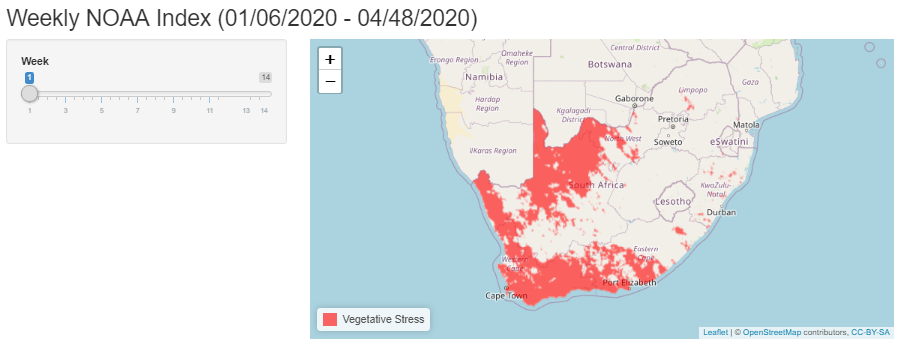
The two ShinyApps below show the outcomes of each drought index. By sliding the time-scale, you can switch between raster layers.
[add photo]
Results & Improvements
Results
Deciles: Deciles does not seem like a great way to analyze rainfall across space. These maps confirm that the eastern half of South Africa receives more rainfall than the western half. Having looked at some maps of ecoregions in South Africa, it seems that the western portion of South Africa has a drier climate and more arid landscape overall. Since we are broadly interested in the state of agricultural land, we could improve these results by limiting the geographic extent to arabale land or to regions with large amounts of agriculture. This would then limit decile value and exclude arid regions.

NOAA Drought: The NOAA Drought Index seems like a better metric for monitoring drough as a season progresses. First of all, it is a weekly metric and is therefore more sensitive to changes in rainfall. In addition, each pixel is treated independently, meaning it is only compared to its past self. As a result, it is a better at showing trends over space. In the future, the use of this metric could be improved by determining a threshold for true drought, i.e. how many consecutive weeks does an area need to experience water stress before it's considered critical for agricultural yields?
Additional Improvements
This initial package produces drought indices which only utilize rainfall data. On one hand, having one dataset makes it much easier to calculate indices. However, these are not necessarily the best indices for measuring vegetative stress because they exclude important variables such as soil moisture and evapotranspiration. For future development, we would suggest developing and incorporating more sophisticated metrics.
Additionally, though this package successfully produces an interactive ShinyApp. It would be better to host the app externally. This would hopefully improve the speed of the data reactivation as the user moves the slider thereby improving the entire user experience.
eevenden/SouthAfricaDrought documentation built on Jan. 1, 2021, 12:14 a.m.
R Package Documentation
Browse R Packages
We want your feedback!
Note that we can't provide technical support on individual packages. You should contact the package authors for that.
SouthAfricaDrought
Authors: Emily Evenden and Maseeng Masitha
Date: December 22, 2020
Introduction
This page hosts the R-package "SouthAfricaDrought", our final project for the "Geospatial Analysis with R" course at Clark University.
We aim to identify areas of drought in South Africa over the summer season of November, 2019, to March, 2020. Drought is determined by persisting stretches of no rainfall. We will use two drought indices which rely solely on rainfall data: the Deciles Index and the NOAA Drought Index to identify areas of South Africa experiencing drought. Through this project, we hope to program easy drought metrics for South Africa which could be used to determine early warnings of low crop yields.
Primary Objectives
-
Make long-term and short-term rainfall data available to the user in both monthly and weekly time intervals
-
Program two drought indices
-
Identify areas in South Africa that experienced drought last Summer (2019-2020).
Approach and Method
Data
This package contains five datasets:
-
SouthAfrica_Boundary - a vector file containing the boundary of South Africa provided by the Humanitarian Data Exchange (available here: https://data.humdata.org/dataset/south-africa-admin-level-1-boundaries)
-
SA_MODIS_Monthly_Mean_Temperature - a raster stack of the average monthly temperature (in Celsius) for South Africa. This dataset is not currently used in any of the indices we created, but is available for future use if more indices are added.
-
& 4. SA_Chirps_Weekly_Mean_Precip & SA_Chirps_Monthly_Mean_Precip - these datasets are two different aggregations of the daily Chirps precipitation data. Obviously, the weekly data is aggregated by week while the monthly data is aggregated by month. The unit of this dataset is mm of rainfall per day.
-
SA_Chirps_30yr_Monthly_Mean_Precip - this datasets is also dervied from the Chirps daily precipitation dataset. Each raster layer in this dataset shows the 30 year average of rainfall for that month. The date range for this data is April 1, 1987 to March 31, 2018.
We obtained datasets for temperature and precipitation from Google Earth Engine (GEE) database. Specifically, we utilized the "Chirps Daily: Climate Hazards Group Infrared Precipitation" dataset (available here: https://developers.google.com/earth-engine/datasets/catalog/UCSB-CHG_CHIRPS_DAILY) and the "Terra Land Surface Temperature and Emissivity Daily Global 1km" dataset (available here: https://developers.google.com/earth-engine/datasets/catalog/MODIS_006_MOD11A1). These datasets were filtered by data and location and reduced using the mean function via the Javascript Code Editor available online through GEE. Once selected, the data was exported to Google Drive.
Finally data preprocessing was conducted using R. Following this, the datasets were clipped in R to the extent of the study area, South Africa. A function for calculating mean monthly amounts for the variables was applied on temperature and precipitation datasets and units converted where appropriate.
Here is an example of our raw data. The plot below shows monthly rainfall data for the months of November, 2019, to March, 2020.
Here is another example of our raw data. This plot shows the weekly rainfall data.
Methods
We used the precipitation data to calculate two drought indices: the Deciles Index and the NOAA Drought Index.
1. Deciles Index
The Deciles Index compares precipitation from a specific time interval with precipitation from a historic time interval (usually 30 years or more). This index only uses precipitation data. The decile method divides each month of historic precipitation data into ten equal parts. These categories can then be used to assess the new time interval. The decile ranges can be categorized as such:
Deciles 1-2: Much below Normal
Deciles 3-4: Below Normal
Deciles 5-6: Near Normal
Deciles 7-8: Above Normal
Deciles 8-9: Much above Normal
Information source: https://agrimetsoft.com/faq/What%20is%20DI(Deciles%20Index)
2. NOAA Drought Index
The NOAA Drought Index is also a precipitation based index. This index utilizes weekly precipitation data for the time interval of interest. In this case, the mean precipitation for an eight-week interval is calculated and then compared with the subsequent ninth week. If the ninth week has more than 60% of the eight-week average, it's classified as having little to no water stress. An area is considered no longer stressed once the rainfall returns to 60% or more.
Information source: https://www.droughtmanagement.info/noaa-drought-index-ndi/
Data Visualization
The two ShinyApps below show the outcomes of each drought index. By sliding the time-scale, you can switch between raster layers. [add photo]
Results & Improvements
Results
Deciles: Deciles does not seem like a great way to analyze rainfall across space. These maps confirm that the eastern half of South Africa receives more rainfall than the western half. Having looked at some maps of ecoregions in South Africa, it seems that the western portion of South Africa has a drier climate and more arid landscape overall. Since we are broadly interested in the state of agricultural land, we could improve these results by limiting the geographic extent to arabale land or to regions with large amounts of agriculture. This would then limit decile value and exclude arid regions.
NOAA Drought: The NOAA Drought Index seems like a better metric for monitoring drough as a season progresses. First of all, it is a weekly metric and is therefore more sensitive to changes in rainfall. In addition, each pixel is treated independently, meaning it is only compared to its past self. As a result, it is a better at showing trends over space. In the future, the use of this metric could be improved by determining a threshold for true drought, i.e. how many consecutive weeks does an area need to experience water stress before it's considered critical for agricultural yields?
Additional Improvements
This initial package produces drought indices which only utilize rainfall data. On one hand, having one dataset makes it much easier to calculate indices. However, these are not necessarily the best indices for measuring vegetative stress because they exclude important variables such as soil moisture and evapotranspiration. For future development, we would suggest developing and incorporating more sophisticated metrics.
Additionally, though this package successfully produces an interactive ShinyApp. It would be better to host the app externally. This would hopefully improve the speed of the data reactivation as the user moves the slider thereby improving the entire user experience.
R Package Documentation
Browse R Packages
We want your feedback!
Note that we can't provide technical support on individual packages. You should contact the package authors for that.
Embedding an R snippet on your website
Add the following code to your website.
For more information on customizing the embed code, read Embedding Snippets.