README.md
In eklavyaj/RandomSplitDiagnostics: The Package allows you to diagnose the randomness and model performance of a given train-test split in machine learning.
Random Split Diagnostics
This package assesses the quality of a random split of a dataset.
About
The analysis is based on a modified version of the Mahalanobis distance, a multidimensional distance measuring technique.
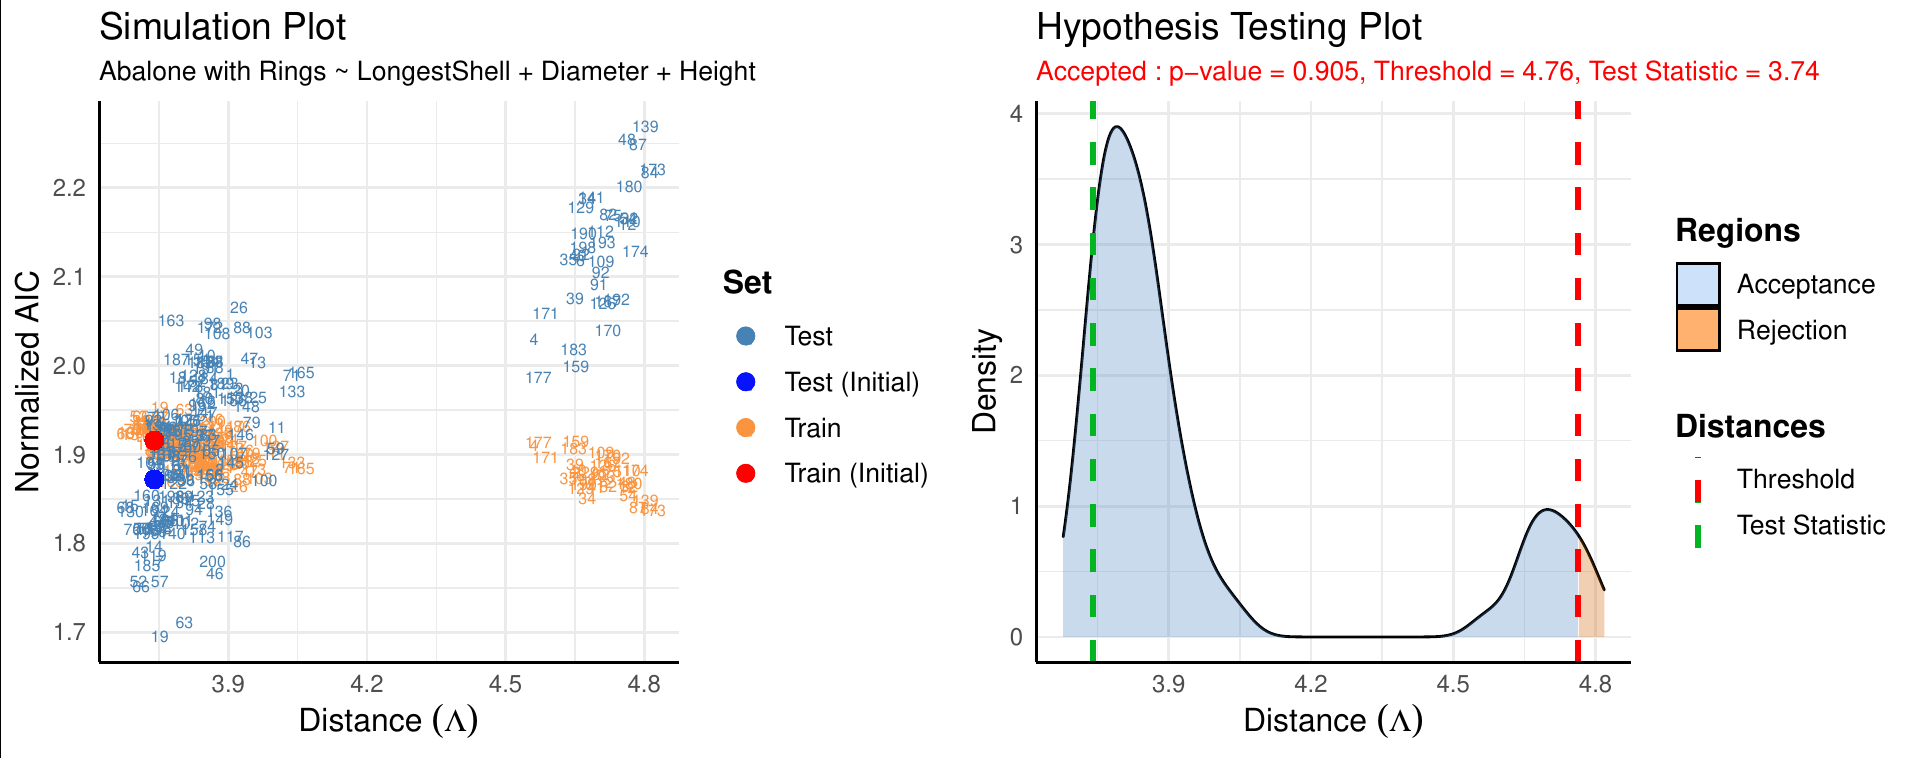
After the user inputs an initial split along with the model relation for regression (in R format), the diagnose() function will return our conclusion in addition to a plot displaying the foundation of our conclusions.
Example
library(RandomSplitDiagnostics)
# data preparation
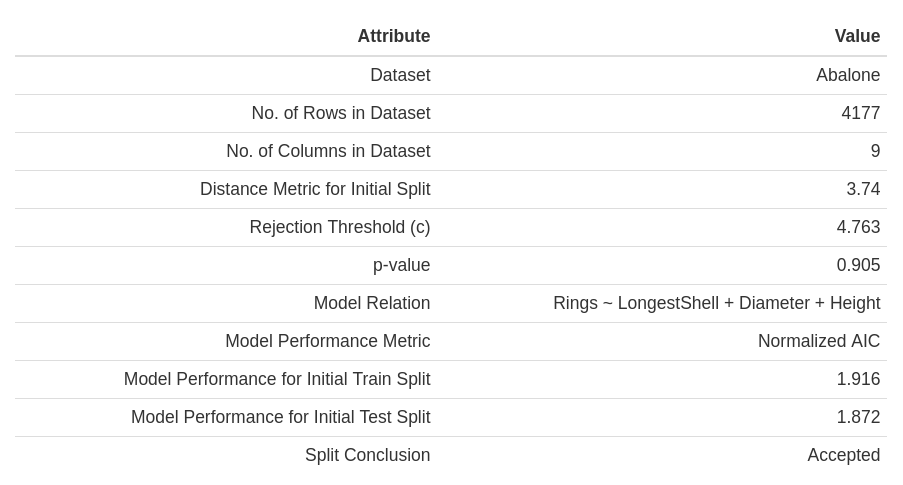
dataset_name <- "Abalone"
data(abalone)
# intial random split of data
s <- sample(x = 1:nrow(abalone), size = floor(nrow(abalone)*0.7), replace = F)
df_train <- abalone[s, ]
df_test <- abalone[-s, ]
# defining model relation based on variables of data
model.relation <- Rings ~ LongestShell + Diameter + Height
# function call
diagnose(dataset.name, df.train, df.test, model.relation = model.relation,
metric.performance = "Normalized AIC", num.simulations = 200,
alpha = 0.05, save.plots = TRUE, output.dir = "Output")
Output Plot
eklavyaj/RandomSplitDiagnostics documentation built on June 1, 2022, 8:36 p.m.
R Package Documentation
Browse R Packages
We want your feedback!
Note that we can't provide technical support on individual packages. You should contact the package authors for that.
Random Split Diagnostics
This package assesses the quality of a random split of a dataset.
About
The analysis is based on a modified version of the Mahalanobis distance, a multidimensional distance measuring technique.
After the user inputs an initial split along with the model relation for regression (in R format), the diagnose() function will return our conclusion in addition to a plot displaying the foundation of our conclusions.
Example
library(RandomSplitDiagnostics)
# data preparation
dataset_name <- "Abalone"
data(abalone)
# intial random split of data
s <- sample(x = 1:nrow(abalone), size = floor(nrow(abalone)*0.7), replace = F)
df_train <- abalone[s, ]
df_test <- abalone[-s, ]
# defining model relation based on variables of data
model.relation <- Rings ~ LongestShell + Diameter + Height
# function call
diagnose(dataset.name, df.train, df.test, model.relation = model.relation,
metric.performance = "Normalized AIC", num.simulations = 200,
alpha = 0.05, save.plots = TRUE, output.dir = "Output")
Output Plot
R Package Documentation
Browse R Packages
We want your feedback!
Note that we can't provide technical support on individual packages. You should contact the package authors for that.
Embedding an R snippet on your website
Add the following code to your website.
For more information on customizing the embed code, read Embedding Snippets.