In gaospecial/ggVennDiagram: A 'ggplot2' Implement of Venn Diagram
knitr::opts_chunk$set(
  collapse = TRUE,
  comment = "#>",
  fig.width = 7
)
devtools::load_all()
library(dplyr)
library(pak)
genes <- paste("gene",1:1000,sep="")
set.seed(20231214)
x <- list(A=sample(genes,300),
          B=sample(genes,525),
          C=sample(genes,440),
          D=sample(genes,350),
          E=sample(genes,400),
          F=sample(genes,300),
          G=sample(genes,200),
          H=sample(genes,450))
Less dependency
ggVennDiagram has a large package dependencies. This is because we build this package standing on the shoulder of those who came before us.
dependency = c(
    "sf",
    "ggplot2",
    "dplyr",
    "stringr",
    "magrittr",
    "methods",
    "purrr",
    "tibble",
    "plotly",
    "RVenn",
    "tidyr",
    "venn"
)
Although we only import ten packages in the development, the dependence tree is huge.
deps = pak::pkg_deps_tree("gaospecial/ggVennDiagram@V1.1")
deps |> select(package, filesize) |>
  arrange(desc(filesize))
Remove sf dependency
Among them, sf is the heaviest package that ggVennDiagram depend on.
pak_dep = deps |>
  select(package, sysreqs, filesize) |>
  arrange(desc(filesize)) |>
  filter(package %in% dependency)
pak_dep
pak_dep |>
  write.csv("deps.csv")
Package sf not only has the largest size, but also depends on several system packages, such as GDAL, GEOS, PROJ, and so on. Furthermore, two of the sf-dependent packages, s2 and units also have system requirements, especially units, whose system dependence udunits-2 is an additional one that usually not installed by most of the ggVennDiagram users.
deps_sf = pak::pkg_deps("sf")
deps |> filter(package %in% deps_sf$package, sysreqs != "") |>
  select(package, sysreqs, filesize)
However, sf is a necessary for the full functions of ggVennDiagram in shape generation. So it is difficult to remove it. Therefore, we decided to move the shape generation functions to a new package, namely shapeMageR. And only import this package as a "suggestion" in new version of ggVennDiagram.
Other dependencies
Besides, several other packages are removed from dependency list after considerations.
deps |>
  select(package, sysreqs, filesize) |>
  filter(!package %in% pak::pkg_deps("sf")$package,
         !package %in% pak::pkg_deps("ggplot2")$package) |>
  arrange(desc(filesize))
|package | reason |
|-------- | ------------------------------------------|
| plotly | Not the main feature, many dependencies |
| RVenn | Easy to replace |
The author of RVenn agreed to reuse his code and is open for join in the further development of ggVennDiagram. I will also add him as a co-author of the new manuscript.
New dependency after version 1.4.9
Short dependency tree
deps_new = pak::pkg_deps_tree(".")
dependency_new = c(
  "ggplot2",
  "dplyr",
  "methods",
  "tibble",
  "aplot",
  "forcats",
  "venn",
  "yulab.utils")
primary_deps = deps_new |>
  select(package, sysreqs, filesize) |>
  arrange(desc(filesize)) |>
  filter(package %in% dependency_new)
primary_deps
# write.csv(primary_deps, file = "deps_current.csv")
Comparison of dependency
#' Report package dependency
#'
#' @param pkg
#' @param size_cutoff
#' @param n
#' @param exclude
#'
#' @return
#' @export
#'
#' @examples
#' report_package_dependency("ggplot2")
report_package_dependency = function(pkg, size_cutoff = 2^20, n = 3, exclude = NULL){
  # find deps of excluding package
  if (!is.null(exclude)){
    if (is.vector(exclude) & length(exclude) > 1){
      exclude = lapply(exclude, function(x){
        pak::pkg_deps(x) |>
          dplyr::pull(package)
      }) |>
        unlist() |>
        unique()
    } else {
      exclude = pak::pkg_deps(exclude) |> pull(package)
    }
  }

  # find deps and format output
  deps = pak::pkg_deps(pkg) |>
    dplyr::filter(!is.na(ref), !(package %in% exclude)) |>
    dplyr::arrange(desc(filesize)) |>
    dplyr::rowwise() |>
    dplyr::mutate(package_size = paste0(package, " (", scales::number_bytes(filesize, units = "si"), ")"))

  # generating report
  tot_filesize = sum(deps$filesize, na.rm = TRUE) |> scales::number_bytes(units = "si")
  big_pkg = deps |> dplyr::filter(filesize > size_cutoff)
  sys_pkg = deps |> dplyr::filter(sysreqs != "", !is.na(sysreqs),
                                  !package %in% big_pkg$package)
  glue::glue("Summary of '{pkg}' Dependency",
             "",
             "  Total size: {tot_filesize}; {nrow(deps)} package(s), and {nrow(sys_pkg)} system requirement(s).",
             "  Package(s) larger than {scales::number_bytes(size_cutoff, units = 'si')} ({nrow(big_pkg)}): {paste(head(big_pkg$package_size,n), collapse = ', ')}{ifelse(nrow(big_pkg)>n, '...', '.')}",
             "  Additional system dependency ({nrow(sys_pkg)}): {paste(head(sys_pkg$package,n), collapse = ', ')}{ifelse(nrow(sys_pkg)>n, '...', '.')}",
             .sep = "\n")
}
for (tag in c("V0.5.0","V1.0.7","V1.1","V1.2","V1.2.2","V1.4.9")){
  report_package_dependency(paste0("gaospecial/ggVennDiagram@", tag)) |> print()
}
report_package_dependency(".")
report_package_dependency(".", exclude = c("ggplot2","dplyr"))
Current depdency
pkg_deps_tree(".")
More optimizations
The introduction of shapeMageR package
shapeMageR is implemented to deal with the shape generation for plotting complex geometries in ggVennDiagram. It's named after "shape + mage + R". All the related shape generation functions used in ggVennDiagram are transferred to the new shapeMageR package.
- Shape Generation
- Circle
- Ellipse
- Triangle
- Rectangle
- Line
- Dot
- Geometry Processing
- diff
- union
- discern
- overlap
- Shape Transformation
- sf2polygon
- polygon2sf
- Misc
- shape reading
Ready-to-use new shapes
Native support for Upset plot
As been stated in our previous publication, Venn Diagram is not suitable for analyzing more than seven sets. In that case we recommend the Upset plot as an alternative method, which is supported by UpsetR in R platform. We add native support for Upset plot.
This function will be provided on base of aplot.
p1 = ggVennDiagram(x[1:5], label="none", set_color = rainbow(5)) + scale_fill_distiller(palette = "Reds", direction = 1)
p2 = ggVennDiagram(x[1:5], force_upset = TRUE, order.intersect.by = "none", order.set.by = "none", nintersects = 15)

aplot::plot_list(p1,p2, widths = c(0.6, 1))
ggVennDiagram(x, nintersects = 30, order.set.by = "none", order.intersect.by = "size")
Read more:
Optimization of default settings
Transparent background of labels
Gray line of region borders
Region fill colors pallete
Access to classes
set.seed(20231225)
y = list(
  A = sample(letters, 8) |> sort(),
  B = sample(letters, 8) |> sort(),
  C = sample(letters, 8) |> sort(),
  D = sample(letters, 8) |> sort())

# view the list
y
Access to subset items
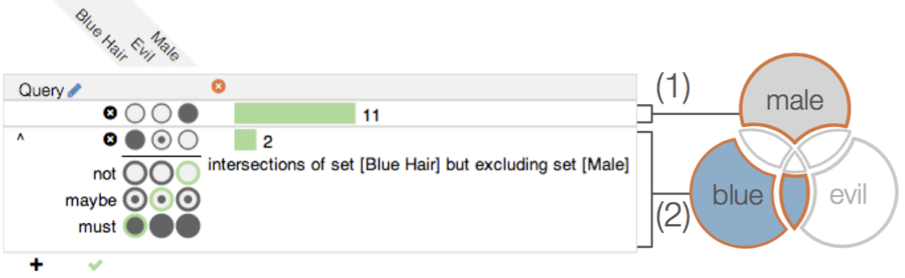
To view subset itmes interactively, set show_intersect = TRUE.
if (knitr::is_html_output()) ggVennDiagram(y, show_intersect = TRUE, set_color = "black")
venn_y = Venn(y)

venn_y
# find the overlaping members of two or more sets
overlap(venn_y, 1:2) # members in both the first two sets
overlap(venn_y) # members in all the sets

# find the different members between sets and set unions
discern(venn_y, 1)  # members in set 1, but not in the resting sets
discern(venn_y, c("A","B"), 3) # members in set A & B, but not in the 3rd set

# find the specific members in one or more sets
discern_overlap(venn_y, 1)  # specific items in set 1
discern_overlap(venn_y, 1:2)  # specific items in set 1 and set 2
Access to plot data
venn_plot_data = process_data(venn_y)

# summary of VennPlotData object
venn_plot_data
Sets and labels
# get the set data
venn_set(venn_plot_data)

# get subsets, i.e., regions
venn_region(venn_plot_data)
Polygons.
# get set edge
venn_setedge(venn_plot_data)

# get region edge
venn_regionedge(venn_plot_data)
df = venn_setedge(venn_plot_data)
ggplot(df, aes(X, Y, group = id, color = id)) +
  geom_path() +
  coord_equal()
df = venn_regionedge(venn_plot_data)
ggplot(df, aes(X, Y, group = id, fill = count)) +
  geom_polygon() +
  geom_path(color = "white", size = 5) +
  scale_fill_distiller(palette = "Reds") +
  coord_equal() +
  theme_void()
Unified coordinations
Transforming coordination.
Work with TBtools
Provide an official TBtools plugin.
TBtools refers to a bioinformatics software tool designed for the analysis and visualization of genomic data. TBtools is often used in genomics and molecular biology research to handle and analyze large-scale biological data. In ggVennDiagram 1.5, we provided an official TBtools plugin in the plugin store of TBtools.
Provided as Shiny app
Shiny provide a web interface to access the core functions of ggVennDiagram. For those light users, it is not a necessary to install ggVennDiagram, as the Shiny app would give publication quality figures with optimized parameters. In addition to bitmap figures (png/jpg/tiff), the Shiny app can also export figure as vector graphics such as PDF, and PPTX. Therefore, the figures can be substantially polished with hands-on software by users.
launch_app()
gaospecial/ggVennDiagram documentation built on Oct. 24, 2024, 11:40 a.m.
R Package Documentation
Browse R Packages
We want your feedback!
Note that we can't provide technical support on individual packages. You should contact the package authors for that.
knitr::opts_chunk$set( collapse = TRUE, comment = "#>", fig.width = 7 )
devtools::load_all() library(dplyr) library(pak)
genes <- paste("gene",1:1000,sep="") set.seed(20231214) x <- list(A=sample(genes,300), B=sample(genes,525), C=sample(genes,440), D=sample(genes,350), E=sample(genes,400), F=sample(genes,300), G=sample(genes,200), H=sample(genes,450))
Less dependency
ggVennDiagram has a large package dependencies. This is because we build this package standing on the shoulder of those who came before us.
dependency = c( "sf", "ggplot2", "dplyr", "stringr", "magrittr", "methods", "purrr", "tibble", "plotly", "RVenn", "tidyr", "venn" )
Although we only import ten packages in the development, the dependence tree is huge.
deps = pak::pkg_deps_tree("gaospecial/ggVennDiagram@V1.1")
deps |> select(package, filesize) |> arrange(desc(filesize))
Remove sf dependency
Among them, sf is the heaviest package that ggVennDiagram depend on.
pak_dep = deps |> select(package, sysreqs, filesize) |> arrange(desc(filesize)) |> filter(package %in% dependency) pak_dep
pak_dep |> write.csv("deps.csv")
Package sf not only has the largest size, but also depends on several system packages, such as GDAL, GEOS, PROJ, and so on. Furthermore, two of the sf-dependent packages, s2 and units also have system requirements, especially units, whose system dependence udunits-2 is an additional one that usually not installed by most of the ggVennDiagram users.
deps_sf = pak::pkg_deps("sf") deps |> filter(package %in% deps_sf$package, sysreqs != "") |> select(package, sysreqs, filesize)
However, sf is a necessary for the full functions of ggVennDiagram in shape generation. So it is difficult to remove it. Therefore, we decided to move the shape generation functions to a new package, namely shapeMageR. And only import this package as a "suggestion" in new version of ggVennDiagram.
Other dependencies
Besides, several other packages are removed from dependency list after considerations.
deps |> select(package, sysreqs, filesize) |> filter(!package %in% pak::pkg_deps("sf")$package, !package %in% pak::pkg_deps("ggplot2")$package) |> arrange(desc(filesize))
|package | reason |
|-------- | ------------------------------------------|
| plotly | Not the main feature, many dependencies |
| RVenn | Easy to replace |
The author of RVenn agreed to reuse his code and is open for join in the further development of ggVennDiagram. I will also add him as a co-author of the new manuscript.
New dependency after version 1.4.9
Short dependency tree
deps_new = pak::pkg_deps_tree(".")
dependency_new = c( "ggplot2", "dplyr", "methods", "tibble", "aplot", "forcats", "venn", "yulab.utils") primary_deps = deps_new |> select(package, sysreqs, filesize) |> arrange(desc(filesize)) |> filter(package %in% dependency_new) primary_deps # write.csv(primary_deps, file = "deps_current.csv")
Comparison of dependency
#' Report package dependency #' #' @param pkg #' @param size_cutoff #' @param n #' @param exclude #' #' @return #' @export #' #' @examples #' report_package_dependency("ggplot2") report_package_dependency = function(pkg, size_cutoff = 2^20, n = 3, exclude = NULL){ # find deps of excluding package if (!is.null(exclude)){ if (is.vector(exclude) & length(exclude) > 1){ exclude = lapply(exclude, function(x){ pak::pkg_deps(x) |> dplyr::pull(package) }) |> unlist() |> unique() } else { exclude = pak::pkg_deps(exclude) |> pull(package) } } # find deps and format output deps = pak::pkg_deps(pkg) |> dplyr::filter(!is.na(ref), !(package %in% exclude)) |> dplyr::arrange(desc(filesize)) |> dplyr::rowwise() |> dplyr::mutate(package_size = paste0(package, " (", scales::number_bytes(filesize, units = "si"), ")")) # generating report tot_filesize = sum(deps$filesize, na.rm = TRUE) |> scales::number_bytes(units = "si") big_pkg = deps |> dplyr::filter(filesize > size_cutoff) sys_pkg = deps |> dplyr::filter(sysreqs != "", !is.na(sysreqs), !package %in% big_pkg$package) glue::glue("Summary of '{pkg}' Dependency", "", " Total size: {tot_filesize}; {nrow(deps)} package(s), and {nrow(sys_pkg)} system requirement(s).", " Package(s) larger than {scales::number_bytes(size_cutoff, units = 'si')} ({nrow(big_pkg)}): {paste(head(big_pkg$package_size,n), collapse = ', ')}{ifelse(nrow(big_pkg)>n, '...', '.')}", " Additional system dependency ({nrow(sys_pkg)}): {paste(head(sys_pkg$package,n), collapse = ', ')}{ifelse(nrow(sys_pkg)>n, '...', '.')}", .sep = "\n") }
for (tag in c("V0.5.0","V1.0.7","V1.1","V1.2","V1.2.2","V1.4.9")){ report_package_dependency(paste0("gaospecial/ggVennDiagram@", tag)) |> print() }
report_package_dependency(".")
report_package_dependency(".", exclude = c("ggplot2","dplyr"))
Current depdency
pkg_deps_tree(".")
More optimizations
The introduction of shapeMageR package
shapeMageR is implemented to deal with the shape generation for plotting complex geometries in ggVennDiagram. It's named after "shape + mage + R". All the related shape generation functions used in ggVennDiagram are transferred to the new shapeMageR package.
- Shape Generation
- Circle
- Ellipse
- Triangle
- Rectangle
- Line
- Dot
- Geometry Processing
- diff
- union
- discern
- overlap
- Shape Transformation
- sf2polygon
- polygon2sf
- Misc
- shape reading
Ready-to-use new shapes
Native support for Upset plot
As been stated in our previous publication, Venn Diagram is not suitable for analyzing more than seven sets. In that case we recommend the Upset plot as an alternative method, which is supported by UpsetR in R platform. We add native support for Upset plot.
This function will be provided on base of aplot.
p1 = ggVennDiagram(x[1:5], label="none", set_color = rainbow(5)) + scale_fill_distiller(palette = "Reds", direction = 1) p2 = ggVennDiagram(x[1:5], force_upset = TRUE, order.intersect.by = "none", order.set.by = "none", nintersects = 15) aplot::plot_list(p1,p2, widths = c(0.6, 1))
ggVennDiagram(x, nintersects = 30, order.set.by = "none", order.intersect.by = "size")
Read more:
Optimization of default settings
Transparent background of labels
Gray line of region borders
Region fill colors pallete
Access to classes
set.seed(20231225) y = list( A = sample(letters, 8) |> sort(), B = sample(letters, 8) |> sort(), C = sample(letters, 8) |> sort(), D = sample(letters, 8) |> sort()) # view the list y
Access to subset items
To view subset itmes interactively, set show_intersect = TRUE.
if (knitr::is_html_output()) ggVennDiagram(y, show_intersect = TRUE, set_color = "black")
venn_y = Venn(y) venn_y
# find the overlaping members of two or more sets overlap(venn_y, 1:2) # members in both the first two sets overlap(venn_y) # members in all the sets # find the different members between sets and set unions discern(venn_y, 1) # members in set 1, but not in the resting sets discern(venn_y, c("A","B"), 3) # members in set A & B, but not in the 3rd set # find the specific members in one or more sets discern_overlap(venn_y, 1) # specific items in set 1 discern_overlap(venn_y, 1:2) # specific items in set 1 and set 2
Access to plot data
venn_plot_data = process_data(venn_y) # summary of VennPlotData object venn_plot_data
Sets and labels
# get the set data venn_set(venn_plot_data) # get subsets, i.e., regions venn_region(venn_plot_data)
Polygons.
# get set edge venn_setedge(venn_plot_data) # get region edge venn_regionedge(venn_plot_data)
df = venn_setedge(venn_plot_data) ggplot(df, aes(X, Y, group = id, color = id)) + geom_path() + coord_equal()
df = venn_regionedge(venn_plot_data) ggplot(df, aes(X, Y, group = id, fill = count)) + geom_polygon() + geom_path(color = "white", size = 5) + scale_fill_distiller(palette = "Reds") + coord_equal() + theme_void()
Unified coordinations
Transforming coordination.
Work with TBtools
Provide an official TBtools plugin.
TBtools refers to a bioinformatics software tool designed for the analysis and visualization of genomic data. TBtools is often used in genomics and molecular biology research to handle and analyze large-scale biological data. In ggVennDiagram 1.5, we provided an official TBtools plugin in the plugin store of TBtools.
Provided as Shiny app
Shiny provide a web interface to access the core functions of ggVennDiagram. For those light users, it is not a necessary to install ggVennDiagram, as the Shiny app would give publication quality figures with optimized parameters. In addition to bitmap figures (png/jpg/tiff), the Shiny app can also export figure as vector graphics such as PDF, and PPTX. Therefore, the figures can be substantially polished with hands-on software by users.
launch_app()
R Package Documentation
Browse R Packages
We want your feedback!
Note that we can't provide technical support on individual packages. You should contact the package authors for that.
Embedding an R snippet on your website
Add the following code to your website.
For more information on customizing the embed code, read Embedding Snippets.