README.md
In gusef/d3Toolbox: Toolbox of interactive visualizations for R/Shiny powered by javascript and d3.js
d3Toolbox
Interactive Shiny visualizations based on d3.js
Install from Github
```{r install, eval=FALSE}
library(devtools)
install_github("gusef/d3Toolbox")
## Interactive heatmap

```{r heatmap, warning=FALSE, eval=FALSE}
colors <- c('#1f78b4','#b2df8a','#33a02c','#fb9a99','#fdbf6f',
'#ff7f00','#cab2d6','#6a3d9a','#ffff99')
x <- t(mtcars[,1:9])
columns <- t(mtcars[10:11])
colCols <- matrix(colors[columns],ncol=ncol(columns))
rownames(colCols) <- rownames(columns)
leg <- list(list(colors = colors[unique(columns[1,])],
text = unique(columns[1,]),
title = rownames(columns)[1]),
list(colors = colors[unique(columns[2,])],
text = unique(columns[2,]),
title = rownames(columns)[2]))
heatmap.d3(x,
scale='row',
ColSideColors = colCols,
legend = leg,
margins = c(150,20,20,80),
main = 'heatmap.d3')
Simple Scatterplot
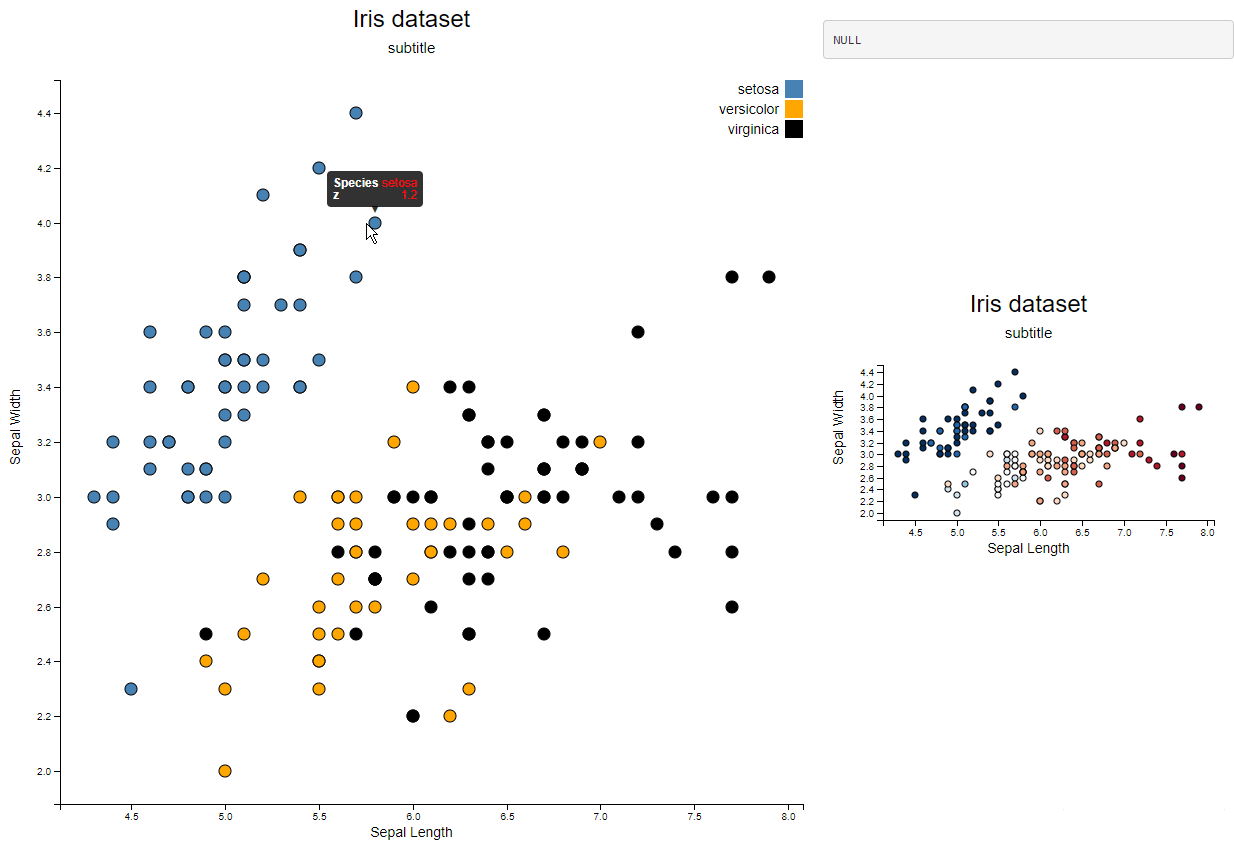
```{r simple_scatter, warning=FALSE, eval=FALSE}
require(d3Toolbox)
data("iris")
data <- data.frame(x=iris$Sepal.Length,
y=iris$Sepal.Width,
z=iris$Petal.Length,
Species=iris$Species)
legend <- data.frame(col=c('steelblue','orange','black'),
name=levels(iris$Species))
d3Scatter(data,
col=c('steelblue','orange','black')[as.numeric(iris$Species)],
dotsize = 6,
xlab='Sepal Length',
ylab='Sepal Width',
title='Iris dataset',
subtitle='subtitle',
tooltip = c('Species','z'),
legend = legend,
callback_handler='ScatterSelection')
## Simple Barplot
```{r simple_barplot, warning=FALSE, eval=FALSE}
require(d3Toolbox)
data <- 1:15
names(data) <- c(LETTERS[1:15])
d3Barplot(data,
col=c('steelblue'),
xlab='Letters',
ylab='Frequencies',
title='New Barplot',
subtitle='with subtitle')
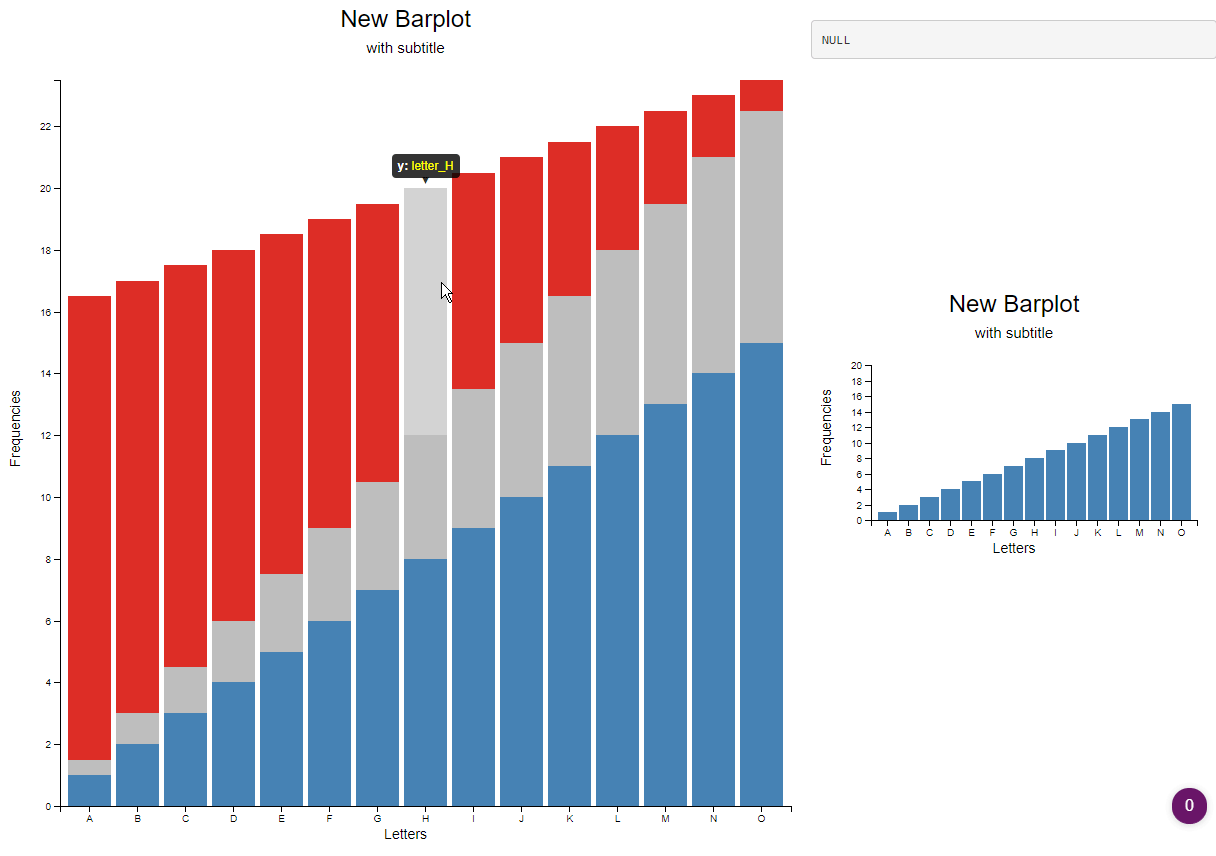
Stacked barplot with tooltips
```{r stacked_barplot, eval=FALSE}
data <- data.frame(x=(1:15),
y=(1:15)/2,
z=15:1)
rownames(data) <- c(LETTERS[1:15])
d3Barplot(data,
col=c('steelblue','grey','#de2d26'),
tooltip=c(paste0('letter_',LETTERS[1:15])),
xlab='Letters',
ylab='Frequencies',
title='New Barplot',
subtitle='with subtitle')
## Simple Boxplot

```{r simple_box, warning=FALSE, eval=FALSE}
require(d3Toolbox)
data <- lapply(levels(iris$Species),
function(x,y)y[y$Species==x,'Sepal.Length'],
iris)
names(data) <- levels(iris$Species)
d3Boxplot(data,
col=c('steelblue','orange','grey'),
dotsize = 3,
showdots = F,
xlab='Sepal Length',
ylab='Sepal Width',
title='Iris dataset',
subtitle='subtitle',
callback_handler='ScatterSelection')
Dendrograms
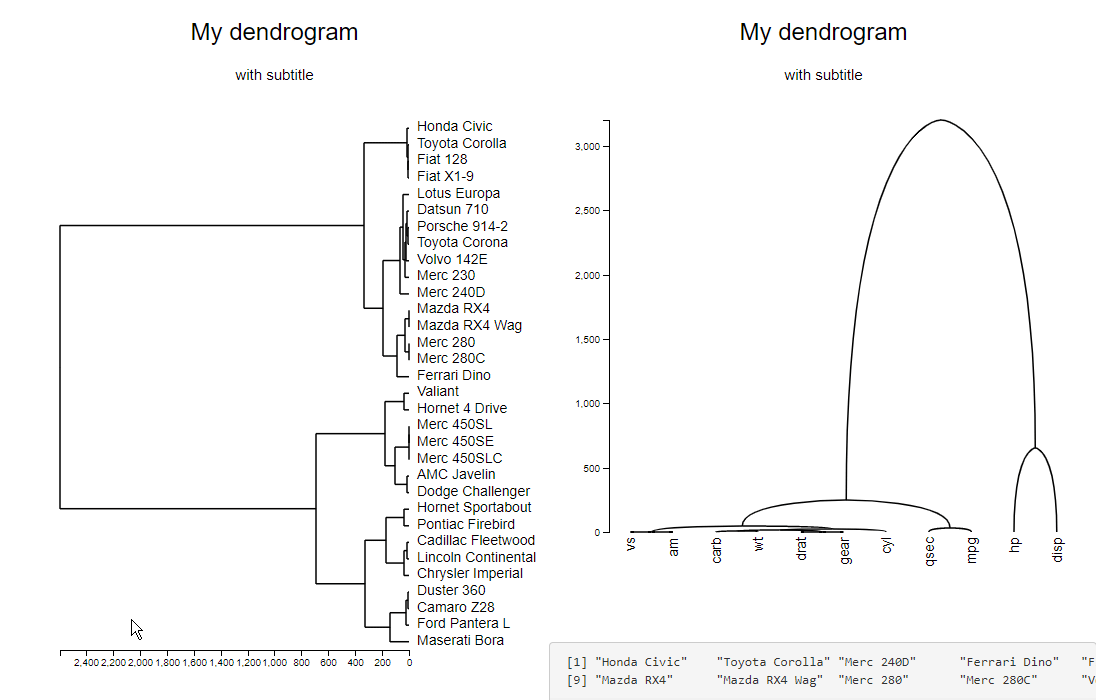
```{r dendrogram1, eval=FALSE}
dat <- t(mtcars)
hc01.col <- hcopt(dist(t(dat)),method="ward.D")
dend <- as.dendrogram(hc01.col)
d3Dendrogram(dend,
horiz=T)
```{r dendrogram2, eval=FALSE}
dat <- mtcars
hc01.col <- hcopt(dist(t(dat)),method="ward.D")
dend <- as.dendrogram(hc01.col)
d3Dendrogram(dend,
             lab_adj = 40,
             classic_tree = F,
             callback_handler="DendSelection")
Base heatmap
 ```{r image, eval=FALSE}
x <- t(mtcars)
rm <- rowMeans(x, na.rm = F)
x <- sweep(x, 1, rm)
sx <- apply(x, 1, sd, na.rm = F)
x <- sweep(x, 1, sx, "/")
```{r image, eval=FALSE}
x <- t(mtcars)
rm <- rowMeans(x, na.rm = F)
x <- sweep(x, 1, rm)
sx <- apply(x, 1, sd, na.rm = F)
x <- sweep(x, 1, sx, "/")
d3Image(mat=x,
xlab='Cars',
ylab='Features',
margins=list(top = 40,
right = 80,
bottom = 150,
left = 60),
show_xlabs=T,
show_ylabs=T,
title='Motor Trend Car Road Tests',
subtitle='mtcars dataset')
```
Shiny
There are several Shiny examples using all these plots in the example directory.
Credits
- RStudio's shiny and htmlwidgets packages
- Michael Bostock' d3.js
- Speros Kokenes' d3 lasso plugin
- Julien Barnier' scatterD3
gusef/d3Toolbox documentation built on Aug. 14, 2021, 1:52 a.m.
R Package Documentation
Browse R Packages
We want your feedback!
Note that we can't provide technical support on individual packages. You should contact the package authors for that.
d3Toolbox
Interactive Shiny visualizations based on d3.js
Install from Github
```{r install, eval=FALSE} library(devtools) install_github("gusef/d3Toolbox")
## Interactive heatmap

```{r heatmap, warning=FALSE, eval=FALSE}
colors <- c('#1f78b4','#b2df8a','#33a02c','#fb9a99','#fdbf6f',
'#ff7f00','#cab2d6','#6a3d9a','#ffff99')
x <- t(mtcars[,1:9])
columns <- t(mtcars[10:11])
colCols <- matrix(colors[columns],ncol=ncol(columns))
rownames(colCols) <- rownames(columns)
leg <- list(list(colors = colors[unique(columns[1,])],
text = unique(columns[1,]),
title = rownames(columns)[1]),
list(colors = colors[unique(columns[2,])],
text = unique(columns[2,]),
title = rownames(columns)[2]))
heatmap.d3(x,
scale='row',
ColSideColors = colCols,
legend = leg,
margins = c(150,20,20,80),
main = 'heatmap.d3')
Simple Scatterplot
```{r simple_scatter, warning=FALSE, eval=FALSE} require(d3Toolbox) data("iris") data <- data.frame(x=iris$Sepal.Length, y=iris$Sepal.Width, z=iris$Petal.Length, Species=iris$Species)
legend <- data.frame(col=c('steelblue','orange','black'), name=levels(iris$Species))
d3Scatter(data, col=c('steelblue','orange','black')[as.numeric(iris$Species)], dotsize = 6, xlab='Sepal Length', ylab='Sepal Width', title='Iris dataset', subtitle='subtitle', tooltip = c('Species','z'), legend = legend, callback_handler='ScatterSelection')
## Simple Barplot

```{r simple_barplot, warning=FALSE, eval=FALSE}
require(d3Toolbox)
data <- 1:15
names(data) <- c(LETTERS[1:15])
d3Barplot(data,
col=c('steelblue'),
xlab='Letters',
ylab='Frequencies',
title='New Barplot',
subtitle='with subtitle')
Stacked barplot with tooltips
```{r stacked_barplot, eval=FALSE} data <- data.frame(x=(1:15), y=(1:15)/2, z=15:1) rownames(data) <- c(LETTERS[1:15])
d3Barplot(data, col=c('steelblue','grey','#de2d26'), tooltip=c(paste0('letter_',LETTERS[1:15])), xlab='Letters', ylab='Frequencies', title='New Barplot', subtitle='with subtitle')
## Simple Boxplot

```{r simple_box, warning=FALSE, eval=FALSE}
require(d3Toolbox)
data <- lapply(levels(iris$Species),
function(x,y)y[y$Species==x,'Sepal.Length'],
iris)
names(data) <- levels(iris$Species)
d3Boxplot(data,
col=c('steelblue','orange','grey'),
dotsize = 3,
showdots = F,
xlab='Sepal Length',
ylab='Sepal Width',
title='Iris dataset',
subtitle='subtitle',
callback_handler='ScatterSelection')
Dendrograms
```{r dendrogram1, eval=FALSE} dat <- t(mtcars) hc01.col <- hcopt(dist(t(dat)),method="ward.D") dend <- as.dendrogram(hc01.col) d3Dendrogram(dend, horiz=T)
```{r dendrogram2, eval=FALSE}
dat <- mtcars
hc01.col <- hcopt(dist(t(dat)),method="ward.D")
dend <- as.dendrogram(hc01.col)
d3Dendrogram(dend,
lab_adj = 40,
classic_tree = F,
callback_handler="DendSelection")
Base heatmap
```{r image, eval=FALSE}
x <- t(mtcars)
rm <- rowMeans(x, na.rm = F)
x <- sweep(x, 1, rm)
sx <- apply(x, 1, sd, na.rm = F)
x <- sweep(x, 1, sx, "/")
d3Image(mat=x, xlab='Cars', ylab='Features', margins=list(top = 40, right = 80, bottom = 150, left = 60), show_xlabs=T, show_ylabs=T, title='Motor Trend Car Road Tests', subtitle='mtcars dataset') ```
Shiny
There are several Shiny examples using all these plots in the example directory.
Credits
- RStudio's shiny and htmlwidgets packages
- Michael Bostock' d3.js
- Speros Kokenes' d3 lasso plugin
- Julien Barnier' scatterD3
R Package Documentation
Browse R Packages
We want your feedback!
Note that we can't provide technical support on individual packages. You should contact the package authors for that.
Embedding an R snippet on your website
Add the following code to your website.
For more information on customizing the embed code, read Embedding Snippets.